
NYSE:MDT Shows Potential for a Breakout.
By Mill Chart
Last update: Sep 26, 2024
Our stock screener has spotted MEDTRONIC PLC (NYSE:MDT) as a possible breakout candidate. A technical breakout setup pattern occurs when the stock is consolidating after a nice uptrend. Whether the actual breakout occurs remains to be seen of course, but it may be interesting to keep an eye on NYSE:MDT.
Zooming in on the technicals.
ChartMill employs a sophisticated system to assign a Technical Rating to every stock in its analysis. This rating, which ranges from 0 to 10, is determined by carefully assessing multiple technical indicators and properties.
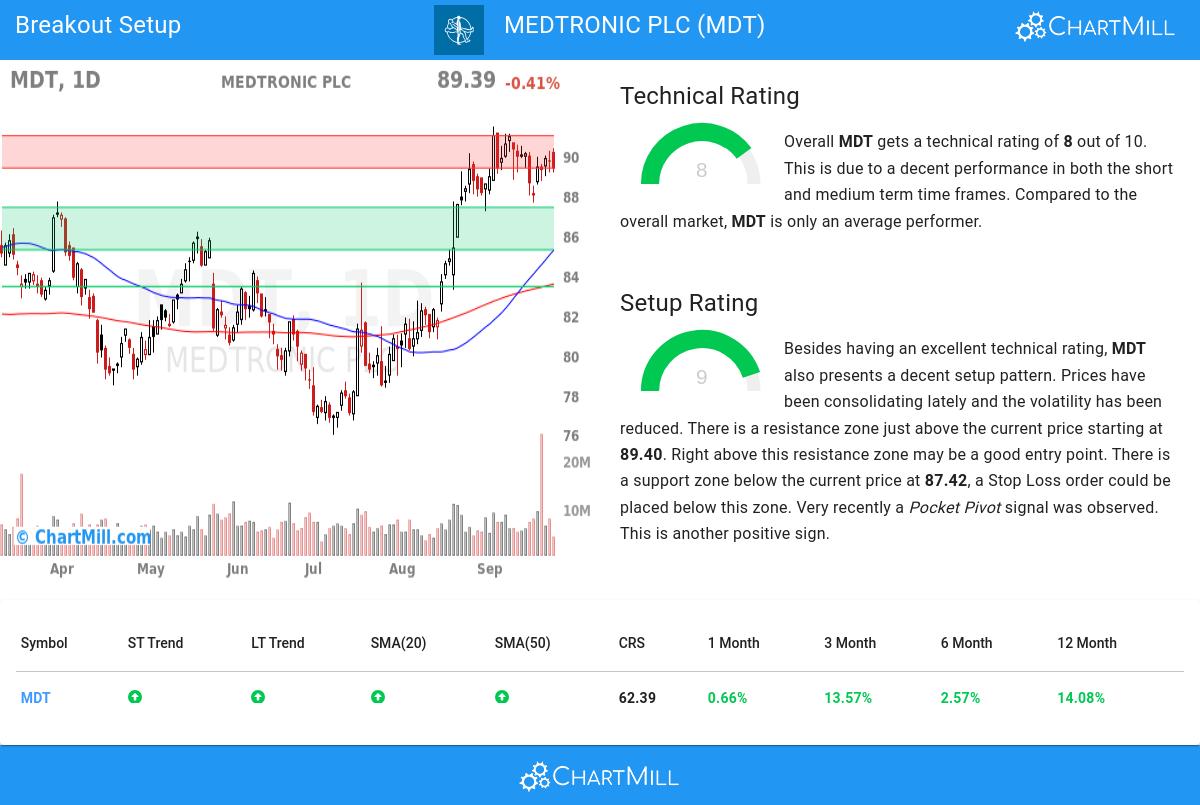
Overall MDT gets a technical rating of 8 out of 10. This is due to a decent performance in both the short and medium term time frames. Compared to the overall market, MDT is only an average performer.
- Both the short term and long term trends are positive. This is a very positive sign.
- MDT is currently trading near its 52 week high, which is a good sign. The S&P500 Index however is also trading near new highs, which makes the performance in line with the market.
- MDT is currently showing a bull flag pattern! A bull flag pattern occurs when prices pull back slightly after a strong rise up. This may be a nice opportunity for an entry.
- Volume is considerably higher in the last couple of days, which is what you like to see during a strong movement up.
- When comparing the performance of all stocks over the past year, MDT turns out to be only a medium performer in the overall market: it outperformed 62% of all stocks.
- MDT is an average performer in the Health Care Equipment & Supplies industry, it outperforms 68% of 188 stocks in the same industry.
- In the last month MDT has a been trading in a tight range between 87.23 and 91.49.
Check the latest full technical report of MDT for a complete technical analysis.
Looking at the Setup
Next to the Technical Rating, the Setup Rating of a stock determines to which extend the stock is consolidating. This score also ranges from 0 to 10 and is updated daily. The setup score evaluates various short term technical indicators. For NYSE:MDT this score is currently 9:
MDT has an excellent technical rating and also presents a decent setup pattern. We see reduced volatility while prices have been consolidating in the most recent period. There is a resistance zone just above the current price starting at 89.40. Right above this resistance zone may be a good entry point. There is a support zone below the current price at 87.42, a Stop Loss order could be placed below this zone. Very recently a Pocket Pivot signal was observed. This is another positive sign.
How can NYSE:MDT be traded?
To potentially initiate a trade, it is common practice to wait for the stock to break out of the consolidation zone. This breakout signifies a potential upward movement, and traders may enter the stock at that point. Conversely, if the stock falls back below the consolidation zone, it may be sold at a loss.
Disclaimer: This article is not intended to provide trading advice. It is crucial to conduct your own analysis and consider your own observations and trading style when making investment decisions. The article solely presents technical observations and should not be relied upon as a sole basis for trading.
Our Breakout screener lists more breakout setups and is updated daily.
Disclaimer
Important Note: The content of this article is not intended as trading advice. It is essential to perform your own analysis and exercise caution when making trading decisions. The article presents observations created by automated analysis but does not guarantee any trading or investment outcomes. Always trade responsibly and make independent judgments.