
Investors should take note of NASDAQ:MANH, a growth stock that remains attractively priced.
By Mill Chart
Last update: Feb 12, 2025
Our stock screener has singled out MANHATTAN ASSOCIATES INC (NASDAQ:MANH) as an attractive growth opportunity. NASDAQ:MANH is demonstrating remarkable growth potential while maintaining strong financial indicators, making it a reasonably priced option. We'll explore this further.
How We Gauge Growth for NASDAQ:MANH
A key component of ChartMill's stock assessment is the Growth Rating, which spans from 0 to 10. This rating evaluates diverse growth factors, such as EPS and revenue growth, considering both past performance and future projections. NASDAQ:MANH has received a 8 out of 10:
- The Earnings Per Share has grown by an impressive 25.80% over the past year.
- The Earnings Per Share has been growing by 22.14% on average over the past years. This is a very strong growth
- The Revenue has grown by 12.24% in the past year. This is quite good.
- Measured over the past years, MANH shows a quite strong growth in Revenue. The Revenue has been growing by 11.02% on average per year.
- The Earnings Per Share is expected to grow by 21.46% on average over the next years. This is a very strong growth
- The Revenue is expected to grow by 12.38% on average over the next years. This is quite good.
How do we evaluate the Valuation for NASDAQ:MANH?
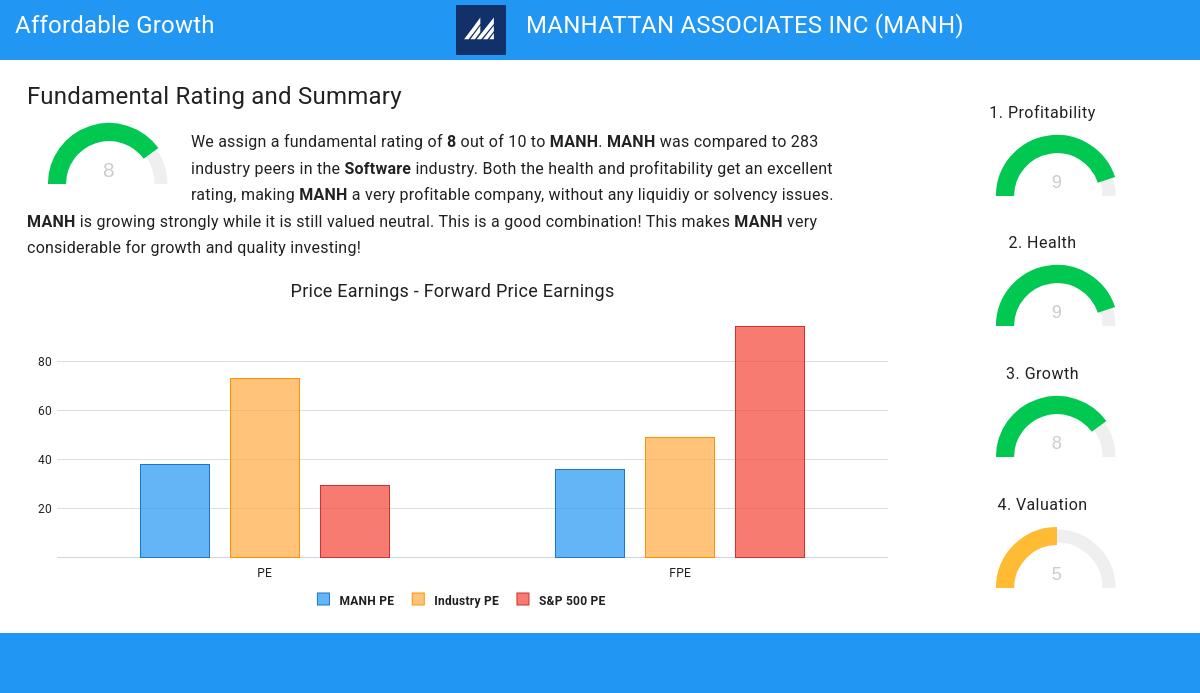
ChartMill provides a Valuation Rating to every stock, ranging from 0 to 10. This rating assesses various valuation aspects, comparing price to earnings and cash flows, while considering factors like profitability and growth. NASDAQ:MANH boasts a 5 out of 10:
- Based on the Price/Earnings ratio, MANH is valued a bit cheaper than 66.30% of the companies in the same industry.
- Based on the Price/Forward Earnings ratio, MANH is valued a bit cheaper than 65.58% of the companies in the same industry.
- MANH's Price/Forward Earnings ratio indicates a rather cheap valuation when compared to the S&P500 average which is at 94.38.
- MANH's Enterprise Value to EBITDA ratio is a bit cheaper when compared to the industry. MANH is cheaper than 72.10% of the companies in the same industry.
- Based on the Price/Free Cash Flow ratio, MANH is valued a bit cheaper than 71.74% of the companies in the same industry.
- MANH has an outstanding profitability rating, which may justify a higher PE ratio.
- MANH's earnings are expected to grow with 13.48% in the coming years. This may justify a more expensive valuation.
Evaluating Health: NASDAQ:MANH
ChartMill utilizes a Health Rating to assess stocks, scoring them on a scale of 0 to 10. This rating takes into account a variety of liquidity and solvency ratios, both in absolute terms and in comparison to industry peers. NASDAQ:MANH has earned a 9 out of 10:
- An Altman-Z score of 17.54 indicates that MANH is not in any danger for bankruptcy at the moment.
- MANH has a Altman-Z score of 17.54. This is amongst the best in the industry. MANH outperforms 92.03% of its industry peers.
- MANH has no outstanding debt. Therefor its Debt/Equity and Debt/FCF ratios are 0 and belong to the best of the industry.
- MANH does not score too well on the current and quick ratio evaluation. However, as it has excellent solvency and profitability, these ratios do not necessarly indicate liquidity issues and need to be evaluated against the specifics of the business.
Understanding NASDAQ:MANH's Profitability
Discover ChartMill's exclusive Profitability Rating, a proprietary metric that assesses stocks on a scale of 0 to 10. It takes into consideration various profitability ratios and margins, both in absolute terms and relative to industry peers. Notably, NASDAQ:MANH has achieved a 9:
- MANH has a better Return On Assets (28.82%) than 98.19% of its industry peers.
- MANH's Return On Equity of 73.00% is amongst the best of the industry. MANH outperforms 98.55% of its industry peers.
- MANH has a better Return On Invested Capital (60.22%) than 99.64% of its industry peers.
- Measured over the past 3 years, the Average Return On Invested Capital for MANH is significantly above the industry average of 11.99%.
- The 3 year average ROIC (55.23%) for MANH is below the current ROIC(60.22%), indicating increased profibility in the last year.
- With an excellent Profit Margin value of 20.95%, MANH belongs to the best of the industry, outperforming 87.68% of the companies in the same industry.
- In the last couple of years the Profit Margin of MANH has grown nicely.
- MANH has a Operating Margin of 25.10%. This is amongst the best in the industry. MANH outperforms 91.67% of its industry peers.
- MANH's Operating Margin has improved in the last couple of years.
Every day, new Affordable Growth stocks can be found on ChartMill in our Affordable Growth screener.
Check the latest full fundamental report of MANH for a complete fundamental analysis.
Disclaimer
This article should in no way be interpreted as advice. The article is based on the observed metrics at the time of writing, but you should always make your own analysis and trade or invest at your own responsibility.
