
Technical Setup: SOUTHWEST AIRLINES CO Appears Poised for a Breakout.
By Mill Chart
Last update: Nov 27, 2024
Our stock screener has identified SOUTHWEST AIRLINES CO (NYSE:LUV) as a potential breakout candidate. This technical breakout setup pattern occurs when the stock consolidates after a strong uptrend. While the actual breakout is uncertain, it may be worth keeping an eye on NYSE:LUV.
What is the technical picture of NYSE:LUV telling us.
ChartMill employs a sophisticated system to assign a Technical Rating to every stock in its analysis. This rating, which ranges from 0 to 10, is determined by carefully assessing multiple technical indicators and properties.
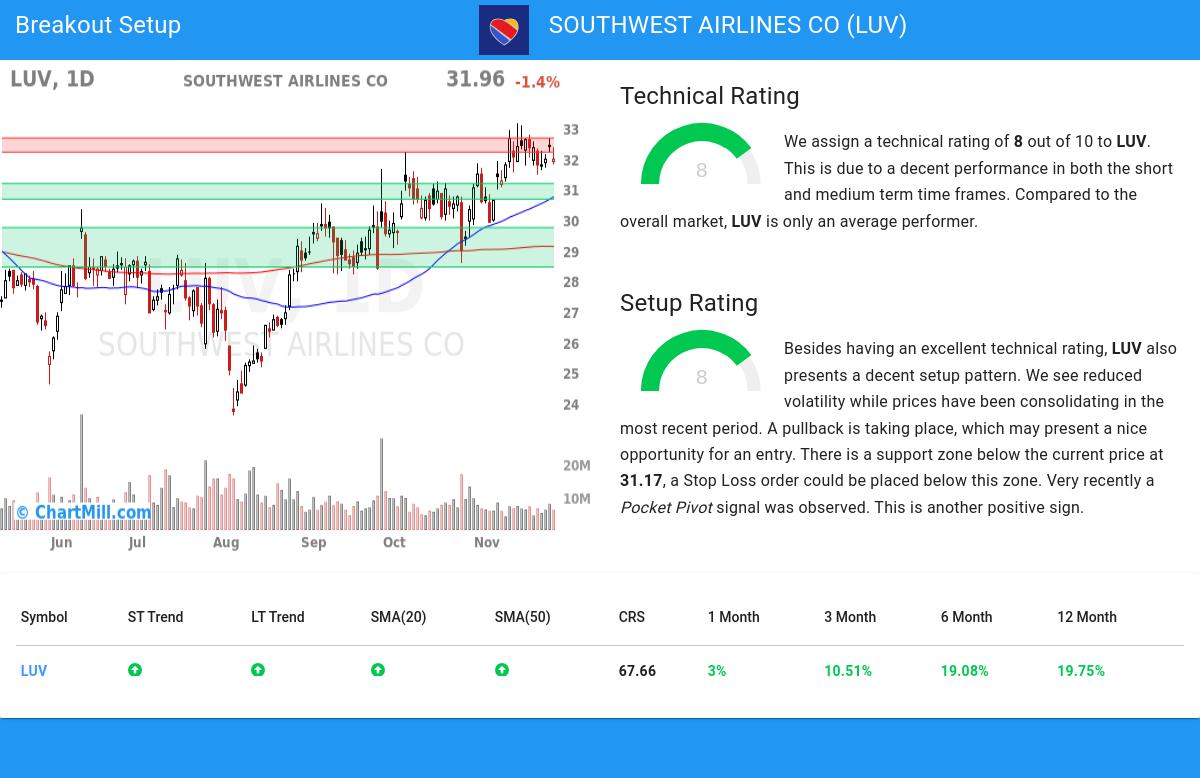
Overall LUV gets a technical rating of 8 out of 10. This is due to a decent performance in both the short and medium term time frames. Compared to the overall market, LUV is only an average performer.
- The long and short term trends are both positive. This is looking good!
- LUV is currently trading in the upper part of its 52 week range. The S&P500 Index however is currently trading near a new high, so LUV is lagging the market slightly.
- LUV is currently showing a bull flag pattern! A bull flag pattern occurs when prices pull back slightly after a strong rise up. This may be a nice opportunity for an entry.
- When comparing the performance of all stocks over the past year, LUV turns out to be only a medium performer in the overall market: it outperformed 67% of all stocks.
- LUV is an average performer in the Passenger Airlines industry, it outperforms 40% of 23 stocks in the same industry.
Check the latest full technical report of LUV for a complete technical analysis.
Looking at the Setup
ChartMill incorporates a Setup Rating in its analysis, which measures the extent of consolidation in a stock over recent days and weeks. This rating, ranging from 0 to 10, is updated daily and takes into account multiple short-term technical indicators. The current setup rating for NYSE:LUV is 8:
Besides having an excellent technical rating, LUV also presents a decent setup pattern. We see reduced volatility while prices have been consolidating in the most recent period. A pullback is taking place, which may present a nice opportunity for an entry. There is a support zone below the current price at 31.17, a Stop Loss order could be placed below this zone. Another positive sign is the recent Pocket Pivot signal.
How to trade NYSE:LUV?
One way to play this would be to wait for the actual breakout to happen and buy when the stock breaks out above the current consolidation zone. A possible place for a stop loss would be below this zone.
Of course, there are many ways to trade or not trade NYSE:LUV and this article should in no way be interpreted as trading advice. The article is purely based on an automated technical analysis and just points out the technical observations. Always make your own analysis and trade at your own responsibility.
Every day, new breakout setups can be found on ChartMill in our Breakout screener.
Keep in mind
This is not investing advice! The article highlights some of the observations at the time of writing, but you should always make your own analysis and invest based on your own insights.
26.46
+0.94 (+3.68%)
Find more stocks in the Stock Screener
LUV Latest News and Analysis
 22 hours ago - ChartmillThursday's pre-market session: top gainers and losers in the S&P500 index
Let's have a look at what is happening on the US markets before the opening bell on Thursday. Below you can find the top S&P500 gainers and losers in today's pre-market session.
 2 days ago - ChartmillWhich S&P500 stocks are moving after the closing bell on Wednesday?
Let's have a look at what is happening on the US markets after the closing bell on Wednesday. Below you can find the top S&P500 gainers and losers in today's after hours session.
 11 days ago - ChartmillExplore the top gainers and losers within the S&P500 index in today's session.
Let's have a look at the top S&P500 gainers and losers one hour before the close of the markets of today's session.
11 days ago - ChartmillExplore the top gainers and losers within the S&P500 index in today's session.Stay informed about the performance of the S&P500 index in the middle of the day on Monday. Uncover the top gainers and losers in today's session for valuable insights.
 11 days ago - ChartmillGapping S&P500 stocks in Monday's session
Looking for opportunities in today's market? Check out the S&P500 gap up and gap down stocks on Monday and stay ahead of the market trends.
