
Technical Setup: SOUTHWEST AIRLINES CO Appears Poised for a Breakout.
By Mill Chart
Last update: Oct 21, 2024
A possible breakout setup was detected on SOUTHWEST AIRLINES CO (NYSE:LUV) by our stockscreener. A breakout pattern is formed when a stock consolidates after a strong rise up. We note that this pattern is detected purely based on technical analysis and whether the breakout actually materializes remains to be seen. It could be interesting to keep an eye on NYSE:LUV.
In-Depth Technical Analysis of NYSE:LUV
At ChartMill, a crucial aspect of their analysis is the assignment of a Technical Rating to each stock. This rating, ranging from 0 to 10, is calculated daily by considering numerous technical indicators and properties.
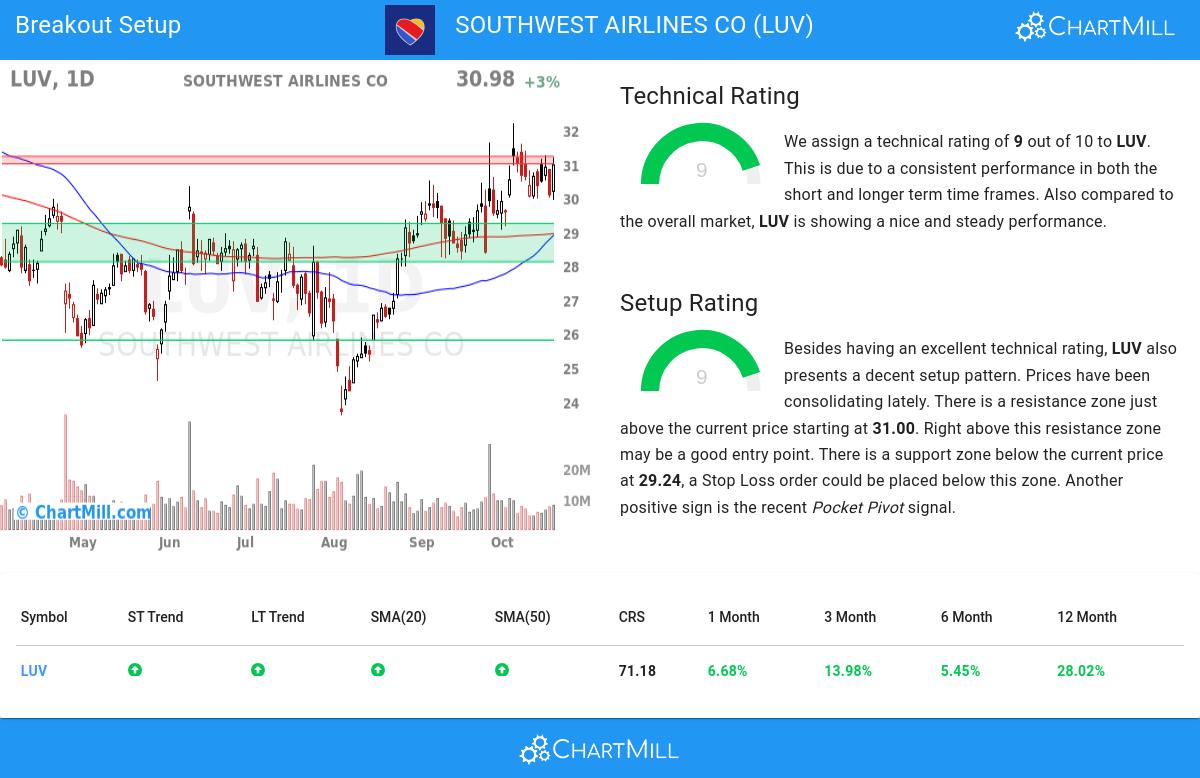
We assign a technical rating of 9 out of 10 to LUV. This is due to a consistent performance in both the short and longer term time frames. Also compared to the overall market, LUV is showing a nice and steady performance.
- Both the short term and long term trends are positive. This is a very positive sign.
- Looking at the yearly performance, LUV did better than 71% of all other stocks.
- LUV is an average performer in the Passenger Airlines industry, it outperforms 65% of 24 stocks in the same industry.
- LUV is currently trading in the middle of its 52 week range. The S&P500 Index however is currently trading near new highs, so LUV is lagging the market.
- In the last month LUV has a been trading in the 28.36 - 32.20 range, which is quite wide. It is currently trading in the middle of this range, so some resistance may be found above.
Check the latest full technical report of LUV for a complete technical analysis.
How does the Setup look for NYSE:LUV
ChartMill incorporates a Setup Rating in its analysis, which measures the extent of consolidation in a stock over recent days and weeks. This rating, ranging from 0 to 10, is updated daily and takes into account multiple short-term technical indicators. The current setup rating for NYSE:LUV is 9:
Besides having an excellent technical rating, LUV also presents a decent setup pattern. Prices have been consolidating lately. There is a resistance zone just above the current price starting at 31.00. Right above this resistance zone may be a good entry point. There is a support zone below the current price at 29.24, a Stop Loss order could be placed below this zone. Another positive sign is the recent Pocket Pivot signal.
How to trade NYSE:LUV?
One strategy to consider is waiting for the actual breakout to occur, where the stock breaks out above the current consolidation zone. Traders can then enter a buy position, anticipating further upward momentum. As a risk management measure, it is advisable to set a stop loss order below the consolidation zone.
Important Note: The content of this article is not intended as trading advice. It is essential to perform your own analysis and exercise caution when making trading decisions. The article presents technical observations generated by automated analysis but does not guarantee any trading outcomes. Always trade responsibly and make independent judgments.
More breakout setups can be found in our Breakout screener.
Keep in mind
Important Note: The content of this article is not intended as trading advice. It is essential to perform your own analysis and exercise caution when making trading decisions. The article presents observations created by automated analysis but does not guarantee any trading or investment outcomes. Always trade responsibly and make independent judgments.
26.46
+0.94 (+3.68%)
Find more stocks in the Stock Screener
LUV Latest News and Analysis
 8 hours ago - ChartmillThursday's pre-market session: top gainers and losers in the S&P500 index
Let's have a look at what is happening on the US markets before the opening bell on Thursday. Below you can find the top S&P500 gainers and losers in today's pre-market session.
 a day ago - ChartmillWhich S&P500 stocks are moving after the closing bell on Wednesday?
Let's have a look at what is happening on the US markets after the closing bell on Wednesday. Below you can find the top S&P500 gainers and losers in today's after hours session.
 10 days ago - ChartmillExplore the top gainers and losers within the S&P500 index in today's session.
Let's have a look at the top S&P500 gainers and losers one hour before the close of the markets of today's session.
10 days ago - ChartmillExplore the top gainers and losers within the S&P500 index in today's session.Stay informed about the performance of the S&P500 index in the middle of the day on Monday. Uncover the top gainers and losers in today's session for valuable insights.
 10 days ago - ChartmillGapping S&P500 stocks in Monday's session
Looking for opportunities in today's market? Check out the S&P500 gap up and gap down stocks on Monday and stay ahead of the market trends.
