
SOUTHWEST AIRLINES CO is setting up nicely for a breakout.
By Mill Chart
Last update: Sep 24, 2024
SOUTHWEST AIRLINES CO (NYSE:LUV) was identified as a Technical Breakout Setup Pattern by our stockscreener. Such a pattern occurs when we see a pause in a strong uptrend: after a strong rise the stock is consolidating a bit and at some point the trend may be continued. Whether this actually happens can not be predicted of course, but it may be a good idea to keep and eye on NYSE:LUV.
Technical analysis of NYSE:LUV
ChartMill assigns a proprietary Technical Rating to each stock. The score is computed daily by evaluating various technical indicators and properties. The score ranges from 0 to 10.
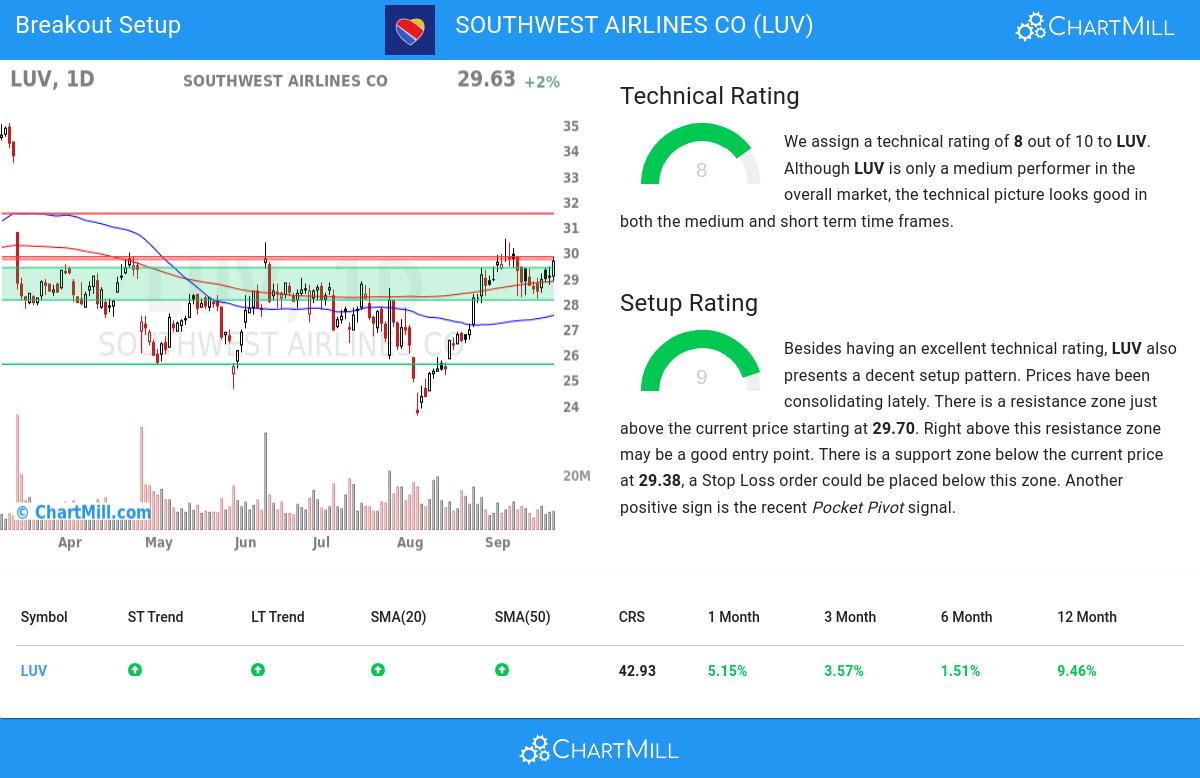
Overall LUV gets a technical rating of 8 out of 10. This is due to a decent performance in both the short and medium term time frames. Compared to the overall market, LUV is only an average performer.
- The long and short term trends are both positive. This is looking good!
- LUV is currently showing a bull flag pattern! A bull flag pattern occurs when prices pull back slightly after a strong rise up. This may be a nice opportunity for an entry.
- When compared to the yearly performance of all other stocks, LUV outperforms 42% of them, which is more or less in line with the market.
- LUV is an average performer in the Passenger Airlines industry, it outperforms 65% of 24 stocks in the same industry.
- LUV is currently trading in the middle of its 52 week range. The S&P500 Index however is currently trading near new highs, so LUV is lagging the market.
For an up to date full technical analysis you can check the technical report of LUV
How does the Setup look for NYSE:LUV
ChartMill incorporates a Setup Rating in its analysis, which measures the extent of consolidation in a stock over recent days and weeks. This rating, ranging from 0 to 10, is updated daily and takes into account multiple short-term technical indicators. The current setup rating for NYSE:LUV is 9:
Besides having an excellent technical rating, LUV also presents a decent setup pattern. Prices have been consolidating lately. There is a resistance zone just above the current price starting at 29.70. Right above this resistance zone may be a good entry point. There is a support zone below the current price at 29.38, a Stop Loss order could be placed below this zone. Very recently a Pocket Pivot signal was observed. This is another positive sign.
Trading setups like NYSE:LUV
To potentially initiate a trade, it is common practice to wait for the stock to break out of the consolidation zone. This breakout signifies a potential upward movement, and traders may enter the stock at that point. Conversely, if the stock falls back below the consolidation zone, it may be sold at a loss.
Of course, there are many ways to trade or not trade NYSE:LUV and this article should in no way be interpreted as trading advice. The article is purely based on an automated technical analysis and just points out the technical observations. Always make your own analysis and trade at your own responsibility.
Every day, new breakout setups can be found on ChartMill in our Breakout screener.
Disclaimer
This article should in no way be interpreted as advice. The article is based on the observed metrics at the time of writing, but you should always make your own analysis and trade or invest at your own responsibility.
41.17
+0.43 (+1.06%)
Find more stocks in the Stock Screener
LUV Latest News and Analysis

