
NASDAQ:LULU, a strong growth stock, setting up for a breakout.
By Mill Chart
Last update: Sep 13, 2024
In this article, we'll take a closer look at LULULEMON ATHLETICA INC (NASDAQ:LULU) as a potential candidate for growth investing. While it's important for investors to conduct their own research, LULULEMON ATHLETICA INC has piqued our interest by appearing on our strong growth and breakout radar. Let's explore further.
A Closer Look at Growth for NASDAQ:LULU
ChartMill assigns a proprietary Growth Rating to each stock. The score is computed by evaluating various growth aspects, like EPS and revenue growth. We take into account the history as well as the estimated future numbers. NASDAQ:LULU was assigned a score of 8 for growth:
- LULU shows a strong growth in Earnings Per Share. In the last year, the EPS has been growing by 18.93%, which is quite good.
- Measured over the past years, LULU shows a very strong growth in Earnings Per Share. The EPS has been growing by 27.05% on average per year.
- LULU shows quite a strong growth in Revenue. In the last year, the Revenue has grown by 13.02%.
- Measured over the past years, LULU shows a very strong growth in Revenue. The Revenue has been growing by 23.95% on average per year.
- Based on estimates for the next years, LULU will show a quite strong growth in Earnings Per Share. The EPS will grow by 13.50% on average per year.
- The Revenue is expected to grow by 11.04% on average over the next years. This is quite good.
Exploring NASDAQ:LULU's Health
ChartMill assigns a proprietary Health Rating to each stock. The score is computed by evaluating various liquidity and solvency ratios and ranges from 0 to 10. NASDAQ:LULU was assigned a score of 9 for health:
- An Altman-Z score of 10.82 indicates that LULU is not in any danger for bankruptcy at the moment.
- LULU has a better Altman-Z score (10.82) than 96.00% of its industry peers.
- LULU has no outstanding debt. Therefor its Debt/Equity and Debt/FCF ratios are 0 and belong to the best of the industry.
- A Current Ratio of 2.43 indicates that LULU has no problem at all paying its short term obligations.
Understanding NASDAQ:LULU's Profitability
ChartMill utilizes a Profitability Rating to assess stocks, scoring them on a scale of 0 to 10. This rating takes into account a variety of profitability ratios and margins, both in absolute terms and in comparison to industry peers. NASDAQ:LULU has earned a 9 out of 10:
- LULU's Return On Assets of 24.21% is amongst the best of the industry. LULU outperforms 96.00% of its industry peers.
- LULU has a Return On Equity of 40.49%. This is amongst the best in the industry. LULU outperforms 94.00% of its industry peers.
- LULU has a better Return On Invested Capital (29.51%) than 96.00% of its industry peers.
- LULU had an Average Return On Invested Capital over the past 3 years of 27.36%. This is significantly above the industry average of 12.11%.
- The last Return On Invested Capital (29.51%) for LULU is above the 3 year average (27.36%), which is a sign of increasing profitability.
- Looking at the Profit Margin, with a value of 16.34%, LULU belongs to the top of the industry, outperforming 96.00% of the companies in the same industry.
- In the last couple of years the Profit Margin of LULU has grown nicely.
- Looking at the Operating Margin, with a value of 23.02%, LULU belongs to the top of the industry, outperforming 98.00% of the companies in the same industry.
- LULU has a better Gross Margin (58.54%) than 78.00% of its industry peers.
How do we evaluate the setup for NASDAQ:LULU?
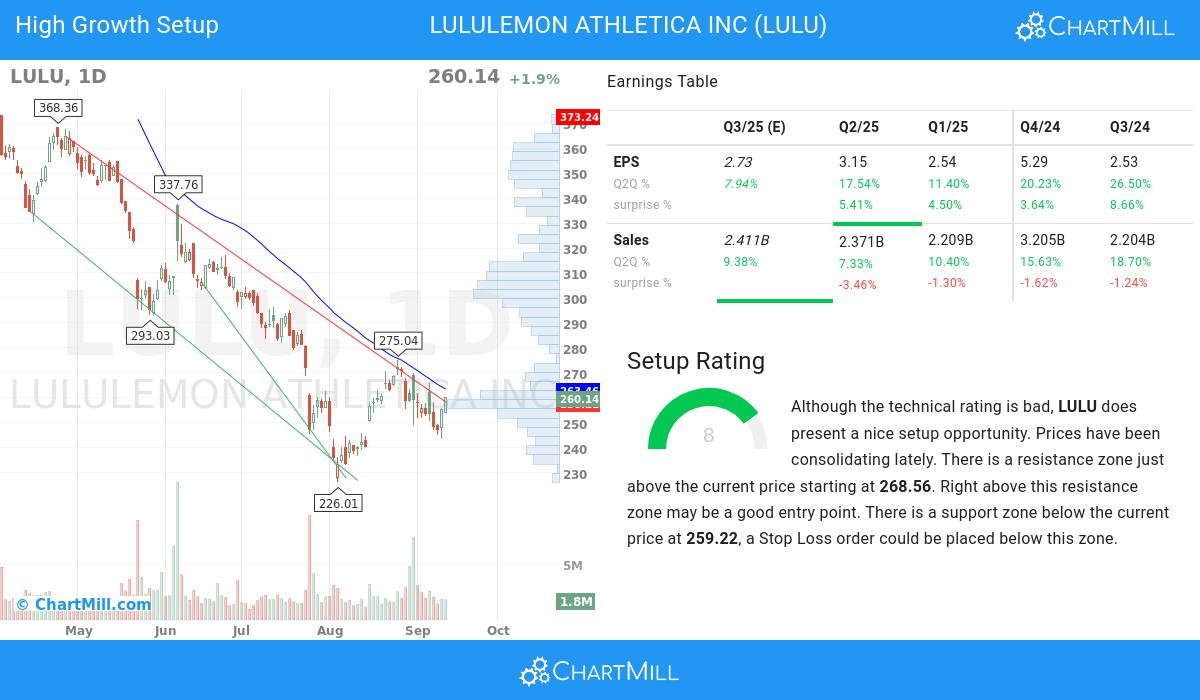
ChartMill incorporates a Setup Rating in its analysis, which measures the extent of consolidation in a stock over recent days and weeks. This rating, ranging from 0 to 10, is updated daily and takes into account multiple short-term technical indicators. The current setup rating for NASDAQ:LULU is 8:
LULU has a bad technical rating, but it does show a decent setup pattern. Prices have been consolidating lately. There is a resistance zone just above the current price starting at 268.56. Right above this resistance zone may be a good entry point. There is a support zone below the current price at 259.22, a Stop Loss order could be placed below this zone.
More Strong Growth stocks can be found in our Strong Growth screener.
Check the latest full fundamental report of LULU for a complete fundamental analysis.
Our latest full technical report of LULU contains the most current technical analsysis.
Disclaimer
This is not investing advice! The article highlights some of the observations at the time of writing, but you should always make your own analysis and invest based on your own insights.
368.22
+9.25 (+2.58%)
Find more stocks in the Stock Screener
LULU Latest News and Analysis
 10 days ago - ChartmillWhat's going on in today's session: S&P500 movers
Curious about the top performers within the S&P500 index one hour before the close of the markets on Friday? Dive into the list of today's session's top gainers and losers for a comprehensive overview.
10 days ago - ChartmillDiscover which S&P500 stocks are making waves on Friday.Curious about the top performers within the S&P500 index in the middle of the day on Friday? Dive into the list of today's session's top gainers and losers for a comprehensive overview.
 10 days ago - ChartmillThese S&P500 stocks are gapping in today's session
Friday's session is showcasing interesting market movements in the S&P500 index, with notable gap up and gap down stocks. Stay updated with the gapping S&P500 stocks in today's session.
