
Based on good technical signals, LIFE TIME GROUP HOLDINGS INC is potentially setting up for a breakout.
By Mill Chart
Last update: Oct 14, 2024
LIFE TIME GROUP HOLDINGS INC (NYSE:LTH) was identified as a Technical Breakout Setup Pattern by our stockscreener. Such a pattern occurs when we see a pause in a strong uptrend: after a strong rise the stock is consolidating a bit and at some point the trend may be continued. Whether this actually happens can not be predicted of course, but it may be a good idea to keep and eye on NYSE:LTH.
What is the technical picture of NYSE:LTH telling us.
Every day, ChartMill assigns a Technical Rating to each stock, providing a score ranging from 0 to 10. This rating is determined by evaluating various technical indicators and properties.
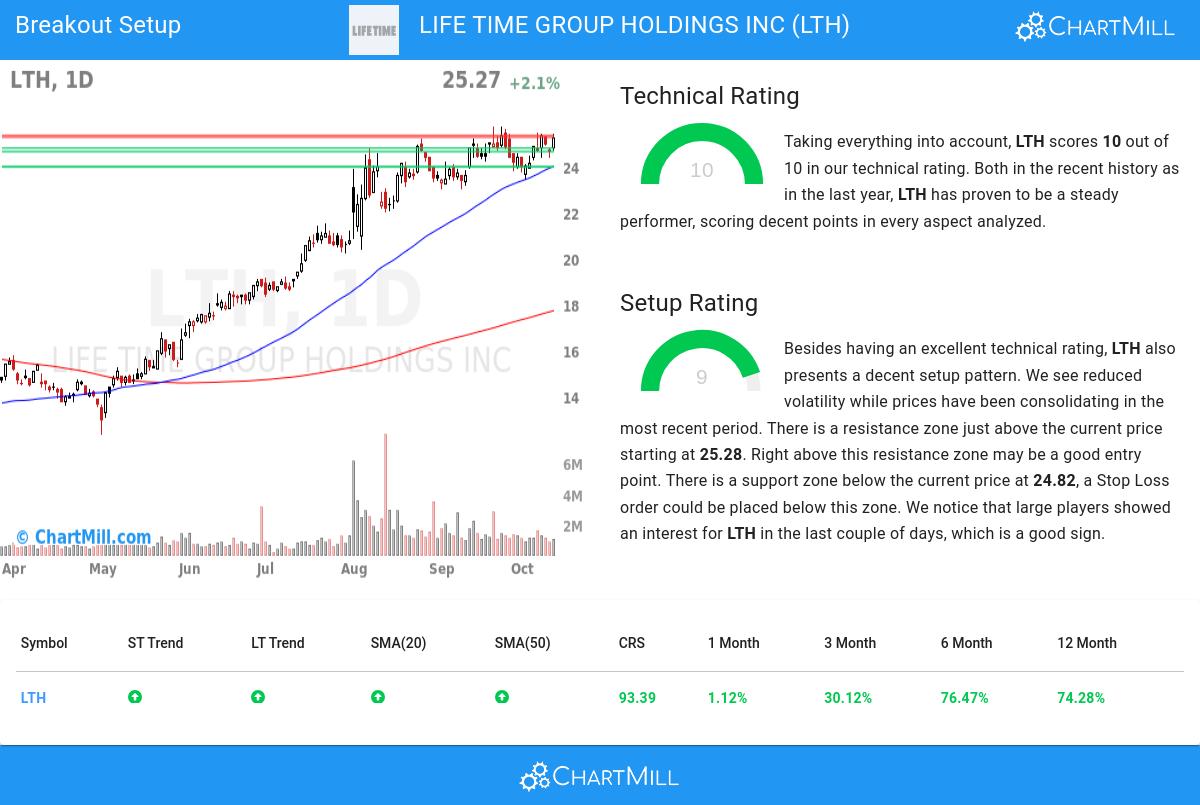
Overall LTH gets a technical rating of 10 out of 10. Both in the recent history as in the last year, LTH has proven to be a steady performer, scoring decent points in every aspect analyzed.
- Both the short term and long term trends are positive. This is a very positive sign.
- When comparing the yearly performance of all stocks, we notice that LTH is one of the better performing stocks in the market, outperforming 93% of all stocks. On top of that, LTH also shows a nice and consistent pattern of rising prices.
- LTH is one of the better performing stocks in the Hotels, Restaurants & Leisure industry, it outperforms 91% of 135 stocks in the same industry.
- LTH is currently trading near its 52 week high, which is a good sign. The S&P500 Index however is also trading near new highs, which makes the performance in line with the market.
- In the last month LTH has a been trading in the 23.43 - 25.75 range, which is quite wide. It is currently trading near the high of this range.
Check the latest full technical report of LTH for a complete technical analysis.
How does the Setup look for NYSE:LTH
In addition to the Technical Rating, ChartMill provides a Setup Rating for each stock. This rating, ranging from 0 to 10, assesses the extent of consolidation in the stock based on multiple short-term technical indicators. Currently, NYSE:LTH has a 9 as its setup rating:
LTH has an excellent technical rating and also presents a decent setup pattern. We see reduced volatility while prices have been consolidating in the most recent period. There is a resistance zone just above the current price starting at 25.28. Right above this resistance zone may be a good entry point. There is a support zone below the current price at 24.82, a Stop Loss order could be placed below this zone. We notice that large players showed an interest for LTH in the last couple of days, which is a good sign.
Trading breakout setups.
One way to play this would be to wait for the actual breakout to happen and buy when the stock breaks out above the current consolidation zone. A possible place for a stop loss would be below this zone.
Please note that this article should not be construed as trading advice. The information provided is solely based on automated technical analysis and serves to highlight technical observations. It is important to conduct your own analysis and make trading decisions based on your own judgment and responsibility.
Every day, new breakout setups can be found on ChartMill in our Breakout screener.
Disclaimer
This article should in no way be interpreted as advice. The article is based on the observed metrics at the time of writing, but you should always make your own analysis and trade or invest at your own responsibility.
