
Our stock screener has singled out STRIDE INC (NYSE:LRN) as an attractive growth opportunity. NYSE:LRN is demonstrating remarkable growth potential while maintaining strong financial indicators, making it a reasonably priced option. We'll explore this further.
How We Gauge Growth for NYSE:LRN
To evaluate a stock's growth potential, ChartMill utilizes a Growth Rating on a scale of 0 to 10. This comprehensive assessment considers various growth aspects, including historical and estimated EPS and revenue growth. NYSE:LRN has achieved a 7 out of 10:
- The Earnings Per Share has grown by an impressive 57.77% over the past year.
- The Earnings Per Share has been growing by 39.31% on average over the past years. This is a very strong growth
- Looking at the last year, LRN shows a quite strong growth in Revenue. The Revenue has grown by 11.03% in the last year.
- The Revenue has been growing by 14.97% on average over the past years. This is quite good.
- LRN is expected to show quite a strong growth in Earnings Per Share. In the coming years, the EPS will grow by 12.65% yearly.
- Based on estimates for the next years, LRN will show a quite strong growth in Revenue. The Revenue will grow by 8.52% on average per year.
Understanding NYSE:LRN's Valuation Score
ChartMill employs its own Valuation Rating system for all stocks. This score, ranging from 0 to 10, is determined by evaluating different valuation factors, including price to earnings and free cash flow, both in absolute terms and relative to the market and industry. NYSE:LRN has earned a 6 for valuation:
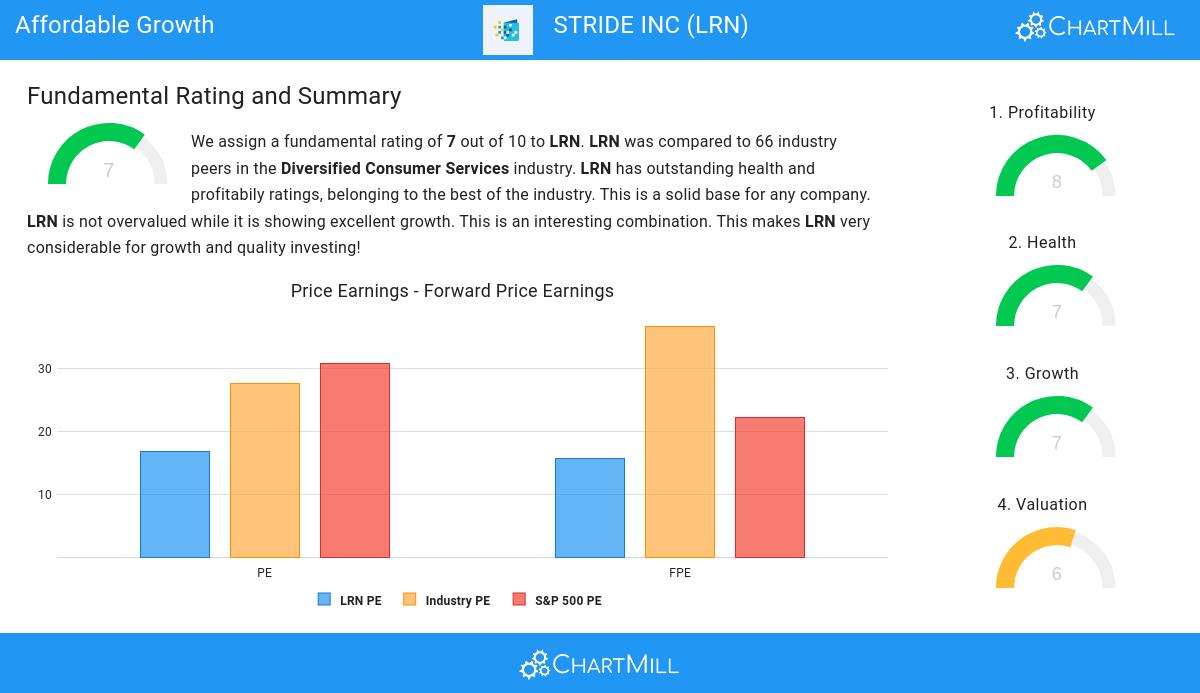
- Compared to the rest of the industry, the Price/Earnings ratio of LRN indicates a somewhat cheap valuation: LRN is cheaper than 75.00% of the companies listed in the same industry.
- Compared to an average S&P500 Price/Earnings ratio of 30.72, LRN is valued a bit cheaper.
- Based on the Price/Forward Earnings ratio, LRN is valued a bit cheaper than 76.56% of the companies in the same industry.
- LRN is valuated rather cheaply when we compare the Price/Forward Earnings ratio to 22.18, which is the current average of the S&P500 Index.
- Based on the Enterprise Value to EBITDA ratio, LRN is valued cheaper than 81.25% of the companies in the same industry.
- 71.88% of the companies in the same industry are more expensive than LRN, based on the Price/Free Cash Flow ratio.
- The excellent profitability rating of LRN may justify a higher PE ratio.
- A more expensive valuation may be justified as LRN's earnings are expected to grow with 12.65% in the coming years.
Exploring NYSE:LRN's Health
ChartMill assigns a Health Rating to every stock. This score ranges from 0 to 10 and evaluates the different health aspects like liquidity and solvency, both absolutely, but also relative to the industry peers. NYSE:LRN scores a 7 out of 10:
- LRN has an Altman-Z score of 5.25. This indicates that LRN is financially healthy and has little risk of bankruptcy at the moment.
- LRN has a better Altman-Z score (5.25) than 87.50% of its industry peers.
- LRN has a debt to FCF ratio of 2.17. This is a good value and a sign of high solvency as LRN would need 2.17 years to pay back of all of its debts.
- LRN has a better Debt to FCF ratio (2.17) than 76.56% of its industry peers.
- LRN has a Debt/Equity ratio of 0.38. This is a healthy value indicating a solid balance between debt and equity.
- A Current Ratio of 5.10 indicates that LRN has no problem at all paying its short term obligations.
- With an excellent Current ratio value of 5.10, LRN belongs to the best of the industry, outperforming 89.06% of the companies in the same industry.
- A Quick Ratio of 4.95 indicates that LRN has no problem at all paying its short term obligations.
- With an excellent Quick ratio value of 4.95, LRN belongs to the best of the industry, outperforming 89.06% of the companies in the same industry.
Assessing Profitability for NYSE:LRN
ChartMill employs its own Profitability Rating system for stock evaluation. This score, ranging from 0 to 10, is derived from an analysis of diverse profitability metrics and margins. In the case of NYSE:LRN, the assigned 8 is noteworthy for profitability:
- With an excellent Return On Assets value of 10.63%, LRN belongs to the best of the industry, outperforming 87.50% of the companies in the same industry.
- LRN has a better Return On Equity (17.36%) than 82.81% of its industry peers.
- With an excellent Return On Invested Capital value of 11.14%, LRN belongs to the best of the industry, outperforming 85.94% of the companies in the same industry.
- The 3 year average ROIC (9.47%) for LRN is below the current ROIC(11.14%), indicating increased profibility in the last year.
- LRN has a Profit Margin of 10.01%. This is in the better half of the industry: LRN outperforms 78.13% of its industry peers.
- In the last couple of years the Profit Margin of LRN has grown nicely.
- The Operating Margin of LRN (12.23%) is better than 75.00% of its industry peers.
- LRN's Operating Margin has improved in the last couple of years.
- LRN's Gross Margin has improved in the last couple of years.
Our Affordable Growth screener lists more Affordable Growth stocks and is updated daily.
For an up to date full fundamental analysis you can check the fundamental report of LRN
Keep in mind
Important Note: The content of this article is not intended as trading advice. It is essential to perform your own analysis and exercise caution when making trading decisions. The article presents observations created by automated analysis but does not guarantee any trading or investment outcomes. Always trade responsibly and make independent judgments.