
LAM RESEARCH CORP (NASDAQ:LRCX) is not too expensive for the growth it is showing.
By Mill Chart
Last update: Mar 4, 2025
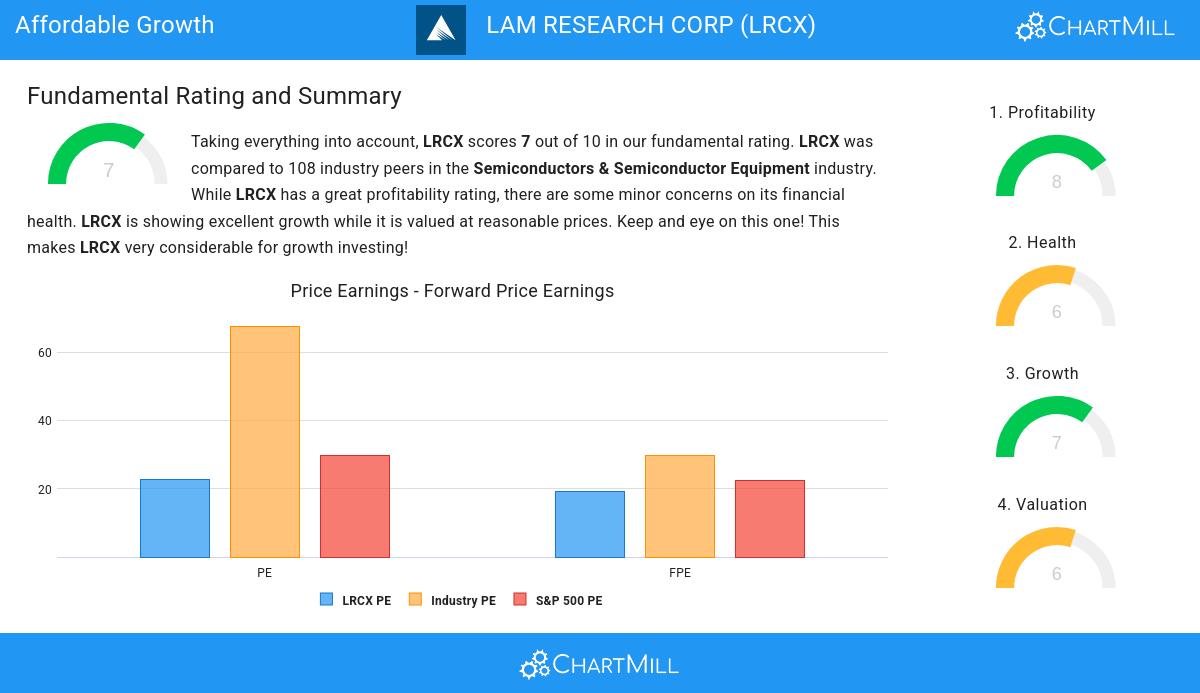
Here's LAM RESEARCH CORP (NASDAQ:LRCX) for you, a growth stock our stock screener believes is undervalued. NASDAQ:LRCX is scoring impressively in terms of growth while demonstrating strong financials. On top of that, it remains attractively priced. Let's break it down further.
Unpacking NASDAQ:LRCX's Growth Rating
Every stock receives a Growth Rating from ChartMill, ranging from 0 to 10. This rating assesses various growth aspects, including historical and projected EPS and revenue growth. NASDAQ:LRCX boasts a 7 out of 10:
- The Earnings Per Share has grown by an impressive 23.01% over the past year.
- The Earnings Per Share has been growing by 15.80% on average over the past years. This is quite good.
- Looking at the last year, LRCX shows a quite strong growth in Revenue. The Revenue has grown by 13.21% in the last year.
- Measured over the past years, LRCX shows a quite strong growth in Revenue. The Revenue has been growing by 9.08% on average per year.
- Based on estimates for the next years, LRCX will show a quite strong growth in Earnings Per Share. The EPS will grow by 13.52% on average per year.
- The Revenue is expected to grow by 10.47% on average over the next years. This is quite good.
Analyzing Valuation Metrics
ChartMill employs its own Valuation Rating system for all stocks. This score, ranging from 0 to 10, is determined by evaluating different valuation factors, including price to earnings and free cash flow, both in absolute terms and relative to the market and industry. NASDAQ:LRCX has earned a 6 for valuation:
- 73.15% of the companies in the same industry are more expensive than LRCX, based on the Price/Earnings ratio.
- LRCX's Price/Earnings ratio indicates a valuation a bit cheaper than the S&P500 average which is at 29.75.
- LRCX's Price/Forward Earnings ratio is a bit cheaper when compared to the industry. LRCX is cheaper than 77.78% of the companies in the same industry.
- LRCX's Enterprise Value to EBITDA ratio is a bit cheaper when compared to the industry. LRCX is cheaper than 68.52% of the companies in the same industry.
- Based on the Price/Free Cash Flow ratio, LRCX is valued cheaper than 83.33% of the companies in the same industry.
- The low PEG Ratio(NY), which compensates the Price/Earnings for growth, indicates a rather cheap valuation of the company.
- LRCX has an outstanding profitability rating, which may justify a higher PE ratio.
- A more expensive valuation may be justified as LRCX's earnings are expected to grow with 16.68% in the coming years.
Looking at the Health
ChartMill assigns a proprietary Health Rating to each stock. The score is computed by evaluating various liquidity and solvency ratios and ranges from 0 to 10. NASDAQ:LRCX was assigned a score of 6 for health:
- LRCX has an Altman-Z score of 9.28. This indicates that LRCX is financially healthy and has little risk of bankruptcy at the moment.
- With an excellent Altman-Z score value of 9.28, LRCX belongs to the best of the industry, outperforming 81.48% of the companies in the same industry.
- The Debt to FCF ratio of LRCX is 1.23, which is an excellent value as it means it would take LRCX, only 1.23 years of fcf income to pay off all of its debts.
- LRCX has a Debt to FCF ratio of 1.23. This is in the better half of the industry: LRCX outperforms 74.07% of its industry peers.
- Although LRCX does not score too well on debt/equity it has very limited outstanding debt, which is well covered by the FCF. We will not put too much weight on the debt/equity number as it may be because of low equity, which could be a consequence of a share buyback program for instance. This needs to be investigated.
- A Current Ratio of 2.54 indicates that LRCX has no problem at all paying its short term obligations.
Profitability Analysis for NASDAQ:LRCX
ChartMill's Profitability Rating offers a unique perspective on stock analysis, providing scores from 0 to 10. These ratings consider a wide range of profitability metrics and margins, both in comparison to industry peers and on their own merits. For NASDAQ:LRCX, the assigned 8 is a significant indicator of profitability:
- With an excellent Return On Assets value of 21.64%, LRCX belongs to the best of the industry, outperforming 96.30% of the companies in the same industry.
- LRCX has a better Return On Equity (48.75%) than 95.37% of its industry peers.
- Looking at the Return On Invested Capital, with a value of 29.27%, LRCX belongs to the top of the industry, outperforming 97.22% of the companies in the same industry.
- The Average Return On Invested Capital over the past 3 years for LRCX is significantly above the industry average of 11.47%.
- LRCX has a better Profit Margin (26.49%) than 87.96% of its industry peers.
- LRCX's Profit Margin has improved in the last couple of years.
- LRCX has a Operating Margin of 29.72%. This is amongst the best in the industry. LRCX outperforms 91.67% of its industry peers.
- In the last couple of years the Operating Margin of LRCX has grown nicely.
More Affordable Growth stocks can be found in our Affordable Growth screener.
For an up to date full fundamental analysis you can check the fundamental report of LRCX
Keep in mind
This article should in no way be interpreted as advice. The article is based on the observed metrics at the time of writing, but you should always make your own analysis and trade or invest at your own responsibility.
160.52
-8.19 (-4.85%)
Find more stocks in the Stock Screener
LRCX Latest News and Analysis


