Investors seeking growth at a reasonable cost should explore NASDAQ:LRCX.
By Mill Chart
Last update: Feb 10, 2025
Our stock screener has spotted LAM RESEARCH CORP (NASDAQ:LRCX) as a growth stock which is not overvalued. NASDAQ:LRCX is scoring great on several growth aspects while it also shows decent health and profitability. At the same time it remains remains attractively priced. We'll dive into each aspect below.
Growth Assessment of NASDAQ:LRCX
Every stock receives a Growth Rating from ChartMill, ranging from 0 to 10. This rating assesses various growth aspects, including historical and projected EPS and revenue growth. NASDAQ:LRCX boasts a 7 out of 10:
- LRCX shows a strong growth in Earnings Per Share. In the last year, the EPS has been growing by 23.01%, which is quite impressive.
- Measured over the past years, LRCX shows a quite strong growth in Earnings Per Share. The EPS has been growing by 15.80% on average per year.
- Looking at the last year, LRCX shows a quite strong growth in Revenue. The Revenue has grown by 13.21% in the last year.
- Measured over the past years, LRCX shows a quite strong growth in Revenue. The Revenue has been growing by 9.08% on average per year.
- LRCX is expected to show quite a strong growth in Earnings Per Share. In the coming years, the EPS will grow by 13.52% yearly.
- LRCX is expected to show quite a strong growth in Revenue. In the coming years, the Revenue will grow by 10.47% yearly.
Analyzing Valuation Metrics
An integral part of ChartMill's stock analysis is the Valuation Rating, which spans from 0 to 10. This rating evaluates diverse valuation factors, including price to earnings and cash flows, while considering the stock's profitability and growth. NASDAQ:LRCX has received a 6 out of 10:
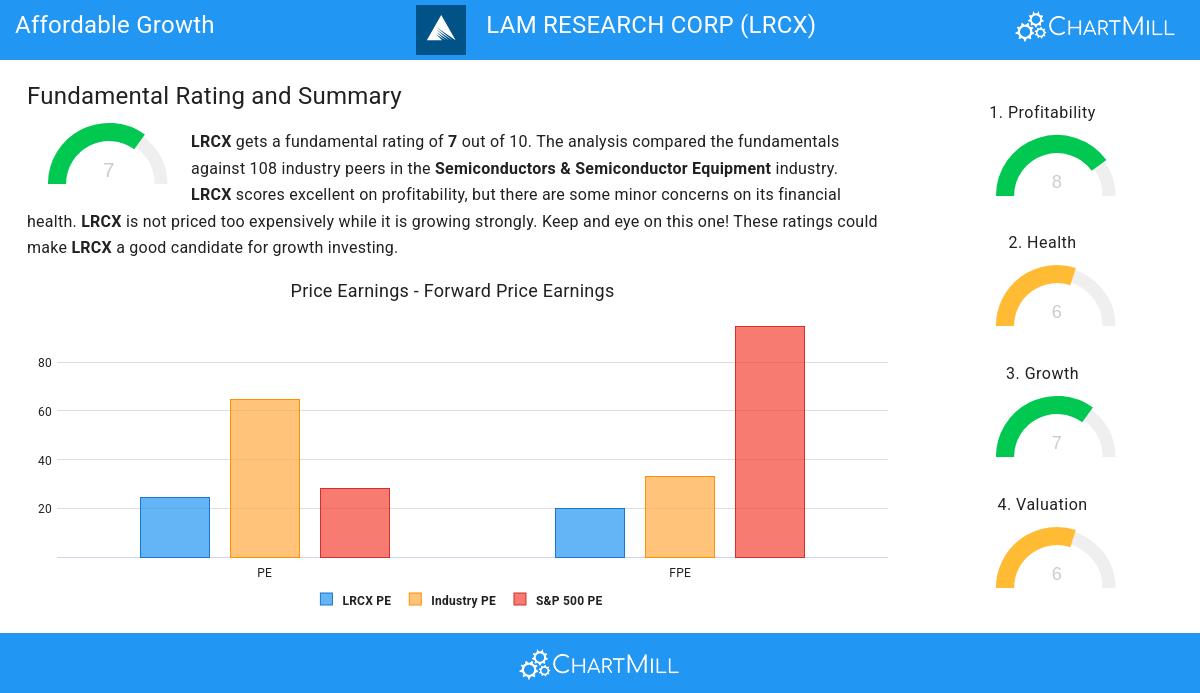
- LRCX's Price/Earnings ratio is a bit cheaper when compared to the industry. LRCX is cheaper than 75.00% of the companies in the same industry.
- Based on the Price/Forward Earnings ratio, LRCX is valued a bit cheaper than the industry average as 77.78% of the companies are valued more expensively.
- Compared to an average S&P500 Price/Forward Earnings ratio of 94.77, LRCX is valued rather cheaply.
- LRCX's Enterprise Value to EBITDA ratio is a bit cheaper when compared to the industry. LRCX is cheaper than 71.30% of the companies in the same industry.
- 83.33% of the companies in the same industry are more expensive than LRCX, based on the Price/Free Cash Flow ratio.
- LRCX has an outstanding profitability rating, which may justify a higher PE ratio.
- LRCX's earnings are expected to grow with 16.88% in the coming years. This may justify a more expensive valuation.
Health Analysis for NASDAQ:LRCX
To gauge a stock's financial health, ChartMill utilizes a Health Rating on a scale of 0 to 10. This comprehensive evaluation encompasses liquidity and solvency, both in absolute terms and in comparison to industry peers. NASDAQ:LRCX has earned a 6 out of 10:
- LRCX has an Altman-Z score of 9.75. This indicates that LRCX is financially healthy and has little risk of bankruptcy at the moment.
- LRCX has a better Altman-Z score (9.75) than 78.70% of its industry peers.
- The Debt to FCF ratio of LRCX is 1.23, which is an excellent value as it means it would take LRCX, only 1.23 years of fcf income to pay off all of its debts.
- LRCX has a Debt to FCF ratio of 1.23. This is in the better half of the industry: LRCX outperforms 76.85% of its industry peers.
- Although LRCX does not score too well on debt/equity it has very limited outstanding debt, which is well covered by the FCF. We will not put too much weight on the debt/equity number as it may be because of low equity, which could be a consequence of a share buyback program for instance. This needs to be investigated.
- LRCX has a Current Ratio of 2.54. This indicates that LRCX is financially healthy and has no problem in meeting its short term obligations.
A Closer Look at Profitability for NASDAQ:LRCX
ChartMill's Profitability Rating offers a unique perspective on stock analysis, providing scores from 0 to 10. These ratings consider a wide range of profitability metrics and margins, both in comparison to industry peers and on their own merits. For NASDAQ:LRCX, the assigned 8 is a significant indicator of profitability:
- With an excellent Return On Assets value of 21.64%, LRCX belongs to the best of the industry, outperforming 97.22% of the companies in the same industry.
- With an excellent Return On Equity value of 48.75%, LRCX belongs to the best of the industry, outperforming 95.37% of the companies in the same industry.
- LRCX's Return On Invested Capital of 29.27% is amongst the best of the industry. LRCX outperforms 97.22% of its industry peers.
- Measured over the past 3 years, the Average Return On Invested Capital for LRCX is significantly above the industry average of 11.95%.
- The Profit Margin of LRCX (26.49%) is better than 87.96% of its industry peers.
- In the last couple of years the Profit Margin of LRCX has grown nicely.
- LRCX has a better Operating Margin (29.72%) than 91.67% of its industry peers.
- In the last couple of years the Operating Margin of LRCX has grown nicely.
Every day, new Affordable Growth stocks can be found on ChartMill in our Affordable Growth screener.
For an up to date full fundamental analysis you can check the fundamental report of LRCX
Keep in mind
This article should in no way be interpreted as advice. The article is based on the observed metrics at the time of writing, but you should always make your own analysis and trade or invest at your own responsibility.
65.14
-3.3 (-4.82%)
Find more stocks in the Stock Screener
LRCX Latest News and Analysis
 16 hours ago - ChartmillDiscover which S&P500 stocks are making waves on Wednesday.
Let's delve into the developments on the US markets in the middle of the day on Wednesday. Below, you'll find the top gainers and losers within the S&P500 index during today's session.
 20 hours ago - ChartmillDon't overlook LAM RESEARCH CORP (NASDAQ:LRCX)—a stock with solid growth prospects and a reasonable valuation.
NASDAQ:LRCX is scoring great on several growth aspects while it also shows decent health and profitability. At the same time it remains remains attractively priced.
 20 hours ago - ChartmillWednesday's pre-market session: top gainers and losers in the S&P500 index
Before the US market kicks off on Wednesday, let's examine the pre-market session and unveil the notable performers among the S&P500 top gainers and losers.
10 days ago - ChartmillWhich S&P500 stocks are moving on Monday?Wondering what's happening in today's session for the S&P500 index? Stay informed with the top movers within the S&P500 index on Monday.
15 days ago - ChartmillTop S&P500 movers in Wednesday's pre-market sessionDiscover the top S&P500 movers in Wednesday's pre-market session and stay informed about market dynamics.
