
Our stock screening tool has pinpointed LAM RESEARCH CORP (NASDAQ:LRCX) as an undervalued stock. NASDAQ:LRCX maintains a solid financial footing. Furthermore, it remains attractively priced. Let's delve into the specifics below.
Deciphering NASDAQ:LRCX's Valuation Rating
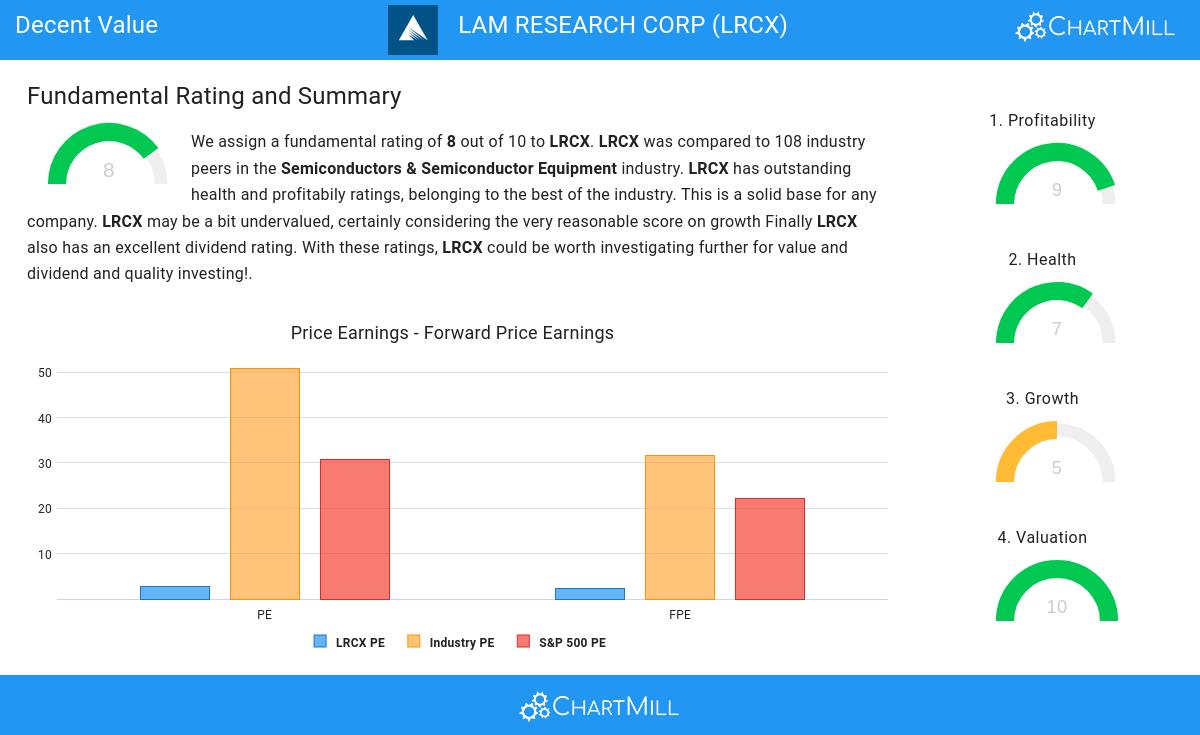
ChartMill employs its own Valuation Rating system for all stocks. This score, ranging from 0 to 10, is determined by evaluating different valuation factors, including price to earnings and free cash flow, both in absolute terms and relative to the market and industry. NASDAQ:LRCX has earned a 10 for valuation:
- LRCX is valuated cheaply with a Price/Earnings ratio of 2.68.
- LRCX's Price/Earnings ratio is rather cheap when compared to the industry. LRCX is cheaper than 99.07% of the companies in the same industry.
- LRCX's Price/Earnings ratio indicates a rather cheap valuation when compared to the S&P500 average which is at 30.77.
- A Price/Forward Earnings ratio of 2.21 indicates a rather cheap valuation of LRCX.
- Based on the Price/Forward Earnings ratio, LRCX is valued cheaply inside the industry as 100.00% of the companies are valued more expensively.
- LRCX's Price/Forward Earnings ratio indicates a rather cheap valuation when compared to the S&P500 average which is at 22.21.
- Based on the Enterprise Value to EBITDA ratio, LRCX is valued cheaply inside the industry as 98.15% of the companies are valued more expensively.
- LRCX's Price/Free Cash Flow ratio is rather cheap when compared to the industry. LRCX is cheaper than 100.00% of the companies in the same industry.
- The low PEG Ratio(NY), which compensates the Price/Earnings for growth, indicates a rather cheap valuation of the company.
- The excellent profitability rating of LRCX may justify a higher PE ratio.
- LRCX's earnings are expected to grow with 20.17% in the coming years. This may justify a more expensive valuation.
Understanding NASDAQ:LRCX's Profitability
ChartMill employs its own Profitability Rating system for stock evaluation. This score, ranging from 0 to 10, is derived from an analysis of diverse profitability metrics and margins. In the case of NASDAQ:LRCX, the assigned 9 is noteworthy for profitability:
- The Return On Assets of LRCX (20.42%) is better than 94.44% of its industry peers.
- Looking at the Return On Equity, with a value of 44.82%, LRCX belongs to the top of the industry, outperforming 98.15% of the companies in the same industry.
- LRCX has a better Return On Invested Capital (26.43%) than 98.15% of its industry peers.
- LRCX had an Average Return On Invested Capital over the past 3 years of 31.96%. This is significantly above the industry average of 10.70%.
- The 3 year average ROIC (31.96%) for LRCX is well above the current ROIC(26.43%). The reason for the recent decline needs to be investigated.
- With an excellent Profit Margin value of 25.68%, LRCX belongs to the best of the industry, outperforming 86.11% of the companies in the same industry.
- LRCX's Profit Margin has improved in the last couple of years.
- The Operating Margin of LRCX (29.02%) is better than 90.74% of its industry peers.
- In the last couple of years the Operating Margin of LRCX has grown nicely.
Understanding NASDAQ:LRCX's Health
ChartMill utilizes a Health Rating to assess stocks, scoring them on a scale of 0 to 10. This rating takes into account a variety of liquidity and solvency ratios, both in absolute terms and in comparison to industry peers. NASDAQ:LRCX has earned a 7 out of 10:
- An Altman-Z score of 4.58 indicates that LRCX is not in any danger for bankruptcy at the moment.
- The Debt to FCF ratio of LRCX is 1.17, which is an excellent value as it means it would take LRCX, only 1.17 years of fcf income to pay off all of its debts.
- LRCX has a better Debt to FCF ratio (1.17) than 75.93% of its industry peers.
- Although LRCX does not score too well on debt/equity it has very limited outstanding debt, which is well covered by the FCF. We will not put too much weight on the debt/equity number as it may be because of low equity, which could be a consequence of a share buyback program for instance. This needs to be investigated.
- LRCX has a Current Ratio of 2.97. This indicates that LRCX is financially healthy and has no problem in meeting its short term obligations.
Evaluating Growth: NASDAQ:LRCX
ChartMill employs its own Growth Rating system for all stocks. This score, ranging from 0 to 10, is derived by evaluating different growth factors, such as EPS and revenue growth, taking into account both past performance and future projections. NASDAQ:LRCX has earned a 5 for growth:
- The Earnings Per Share has been growing by 15.80% on average over the past years. This is quite good.
- LRCX shows quite a strong growth in Revenue. Measured over the last years, the Revenue has been growing by 9.08% yearly.
- The Earnings Per Share is expected to grow by 16.97% on average over the next years. This is quite good.
- LRCX is expected to show quite a strong growth in Revenue. In the coming years, the Revenue will grow by 11.43% yearly.
- When comparing the Revenue growth rate of the last years to the growth rate of the upcoming years, we see that the growth is accelerating.
Our Decent Value screener lists more Decent Value stocks and is updated daily.
For an up to date full fundamental analysis you can check the fundamental report of LRCX
Disclaimer
This article should in no way be interpreted as advice. The article is based on the observed metrics at the time of writing, but you should always make your own analysis and trade or invest at your own responsibility.