
LAM RESEARCH CORP (NASDAQ:LRCX) has caught the attention of dividend investors as a stock worth considering. NASDAQ:LRCX excels in profitability, solvency, and liquidity, all while providing a decent dividend. Let's delve into the details.
Dividend Assessment of NASDAQ:LRCX
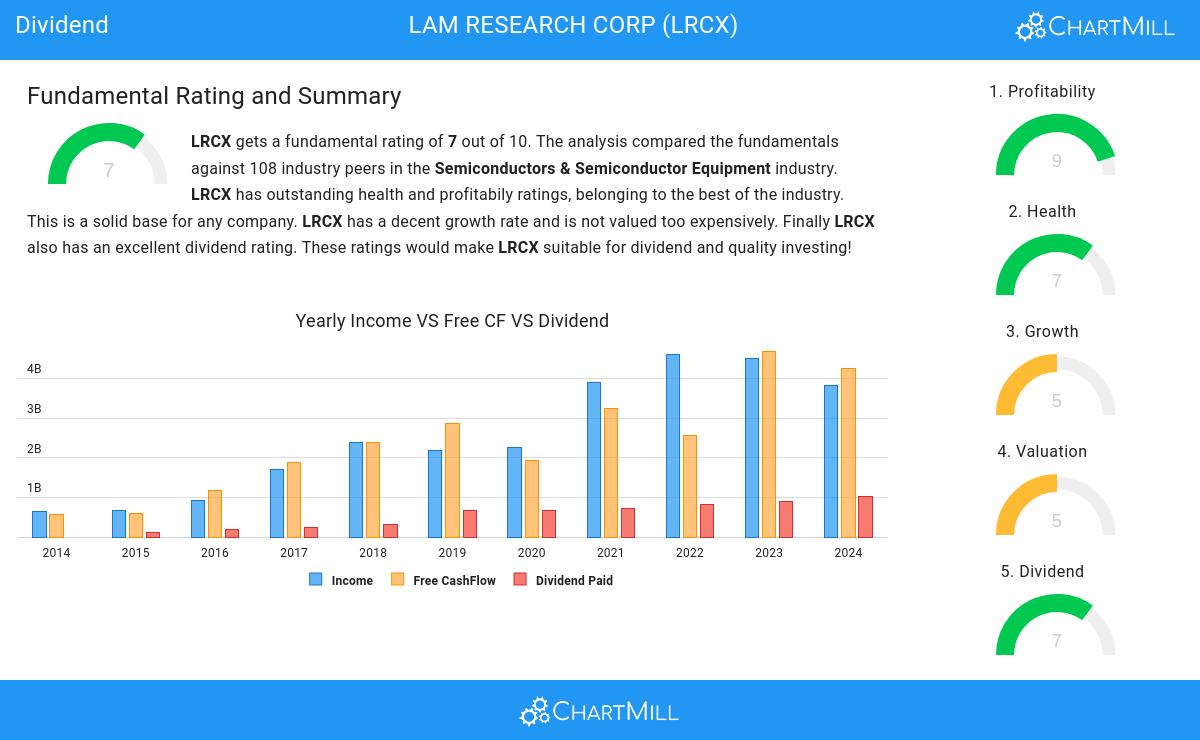
ChartMill assigns a Dividend Rating to each stock, ranging from 0 to 10. This rating is calculated by analyzing various dividend elements, such as yield, historical performance, dividend growth, and sustainability. NASDAQ:LRCX has been awarded a 7 for its dividend quality:
- LRCX's Dividend Yield is rather good when compared to the industry average which is at 2.37. LRCX pays more dividend than 81.48% of the companies in the same industry.
- The dividend of LRCX is nicely growing with an annual growth rate of 11.41%!
- LRCX has paid a dividend for at least 10 years, which is a reliable track record.
- As LRCX did not decrease their dividend in the past 5 years, we can say the dividend looks stable.
- LRCX pays out 26.62% of its income as dividend. This is a sustainable payout ratio.
- LRCX's earnings are growing more than its dividend. This makes the dividend growth sustainable.
Health Assessment of NASDAQ:LRCX
A critical element of ChartMill's stock evaluation is the Health Rating, which spans from 0 to 10. This rating considers multiple health factors, including liquidity and solvency, both in absolute terms and relative to industry peers. NASDAQ:LRCX has received a 7 out of 10:
- LRCX has an Altman-Z score of 9.56. This indicates that LRCX is financially healthy and has little risk of bankruptcy at the moment.
- LRCX has a better Altman-Z score (9.56) than 75.93% of its industry peers.
- The Debt to FCF ratio of LRCX is 1.17, which is an excellent value as it means it would take LRCX, only 1.17 years of fcf income to pay off all of its debts.
- The Debt to FCF ratio of LRCX (1.17) is better than 75.93% of its industry peers.
- Even though the debt/equity ratio score it not favorable for LRCX, it has very limited outstanding debt, so we won't put too much weight on the DE evaluation.
- LRCX has a Current Ratio of 2.97. This indicates that LRCX is financially healthy and has no problem in meeting its short term obligations.
Profitability Assessment of NASDAQ:LRCX
ChartMill utilizes a Profitability Rating to assess stocks, scoring them on a scale of 0 to 10. This rating takes into account a variety of profitability ratios and margins, both in absolute terms and in comparison to industry peers. NASDAQ:LRCX has earned a 9 out of 10:
- Looking at the Return On Assets, with a value of 20.42%, LRCX belongs to the top of the industry, outperforming 94.44% of the companies in the same industry.
- LRCX has a better Return On Equity (44.82%) than 98.15% of its industry peers.
- LRCX's Return On Invested Capital of 26.43% is amongst the best of the industry. LRCX outperforms 98.15% of its industry peers.
- The Average Return On Invested Capital over the past 3 years for LRCX is significantly above the industry average of 10.97%.
- The 3 year average ROIC (31.96%) for LRCX is well above the current ROIC(26.43%). The reason for the recent decline needs to be investigated.
- LRCX's Profit Margin of 25.68% is amongst the best of the industry. LRCX outperforms 86.11% of its industry peers.
- In the last couple of years the Profit Margin of LRCX has grown nicely.
- The Operating Margin of LRCX (29.02%) is better than 90.74% of its industry peers.
- LRCX's Operating Margin has improved in the last couple of years.
More Best Dividend stocks can be found in our Best Dividend screener.
Check the latest full fundamental report of LRCX for a complete fundamental analysis.
Disclaimer
This is not investing advice! The article highlights some of the observations at the time of writing, but you should always make your own analysis and invest based on your own insights.


