
NASDAQ:LNTH, a strong growth stock, setting up for a breakout.
By Mill Chart
Last update: Oct 7, 2024
In this article, we'll take a closer look at LANTHEUS HOLDINGS INC (NASDAQ:LNTH) as a potential candidate for growth investing. While it's important for investors to conduct their own research, LANTHEUS HOLDINGS INC has piqued our interest by appearing on our strong growth and breakout radar. Let's explore further.
How We Gauge Growth for NASDAQ:LNTH
Every stock receives a Growth Rating from ChartMill, ranging from 0 to 10. This rating assesses various growth aspects, including historical and projected EPS and revenue growth. NASDAQ:LNTH boasts a 8 out of 10:
- LNTH shows a strong growth in Earnings Per Share. In the last year, the EPS has been growing by 24.95%, which is quite impressive.
- LNTH shows a strong growth in Earnings Per Share. Measured over the last years, the EPS has been growing by 45.36% yearly.
- Looking at the last year, LNTH shows a very strong growth in Revenue. The Revenue has grown by 27.82%.
- LNTH shows a strong growth in Revenue. Measured over the last years, the Revenue has been growing by 30.43% yearly.
- Based on estimates for the next years, LNTH will show a quite strong growth in Earnings Per Share. The EPS will grow by 14.82% on average per year.
- Based on estimates for the next years, LNTH will show a quite strong growth in Revenue. The Revenue will grow by 15.40% on average per year.
ChartMill's Evaluation of Health
ChartMill employs a unique Health Rating system for all stocks. This rating, ranging from 0 to 10, is determined by analyzing various liquidity and solvency ratios. For NASDAQ:LNTH, the assigned 8 for health provides valuable insights:
- An Altman-Z score of 7.26 indicates that LNTH is not in any danger for bankruptcy at the moment.
- Looking at the Altman-Z score, with a value of 7.26, LNTH belongs to the top of the industry, outperforming 86.56% of the companies in the same industry.
- The Debt to FCF ratio of LNTH is 1.75, which is an excellent value as it means it would take LNTH, only 1.75 years of fcf income to pay off all of its debts.
- LNTH has a better Debt to FCF ratio (1.75) than 89.25% of its industry peers.
- Even though the debt/equity ratio score it not favorable for LNTH, it has very limited outstanding debt, so we won't put too much weight on the DE evaluation.
- A Current Ratio of 4.68 indicates that LNTH has no problem at all paying its short term obligations.
- LNTH has a better Current ratio (4.68) than 70.43% of its industry peers.
- A Quick Ratio of 4.41 indicates that LNTH has no problem at all paying its short term obligations.
- With a decent Quick ratio value of 4.41, LNTH is doing good in the industry, outperforming 72.04% of the companies in the same industry.
A Closer Look at Profitability for NASDAQ:LNTH
ChartMill's Profitability Rating offers a unique perspective on stock analysis, providing scores from 0 to 10. These ratings consider a wide range of profitability metrics and margins, both in comparison to industry peers and on their own merits. For NASDAQ:LNTH, the assigned 8 is a significant indicator of profitability:
- Looking at the Return On Assets, with a value of 22.09%, LNTH belongs to the top of the industry, outperforming 99.46% of the companies in the same industry.
- LNTH's Return On Equity of 41.74% is amongst the best of the industry. LNTH outperforms 99.46% of its industry peers.
- Looking at the Return On Invested Capital, with a value of 21.48%, LNTH belongs to the top of the industry, outperforming 98.92% of the companies in the same industry.
- With an excellent Profit Margin value of 29.80%, LNTH belongs to the best of the industry, outperforming 98.39% of the companies in the same industry.
- In the last couple of years the Profit Margin of LNTH has grown nicely.
- With an excellent Operating Margin value of 31.50%, LNTH belongs to the best of the industry, outperforming 98.39% of the companies in the same industry.
- LNTH's Operating Margin has improved in the last couple of years.
- LNTH's Gross Margin of 64.50% is fine compared to the rest of the industry. LNTH outperforms 65.59% of its industry peers.
- In the last couple of years the Gross Margin of LNTH has grown nicely.
How do we evaluate the setup for NASDAQ:LNTH?
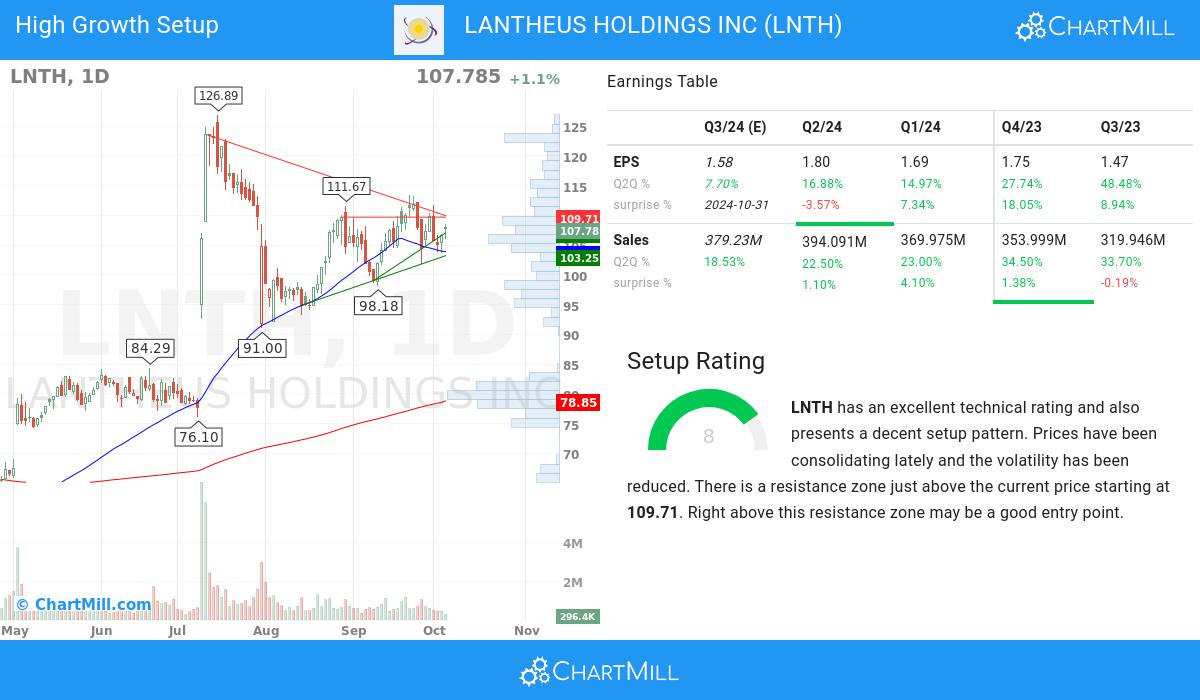
ChartMill also assign a Setup Rating to every stock. With this score it is determined to what extend the stock has been trading in a range in the recent days and weeks. This score also ranges from 0 to 10 and is updated daily. The setup score evaluates various short term technical indicators. NASDAQ:LNTH scores a 8 out of 10:
Besides having an excellent technical rating, LNTH also presents a decent setup pattern. We see reduced volatility while prices have been consolidating in the most recent period. There is a resistance zone just above the current price starting at 109.71. Right above this resistance zone may be a good entry point.
Every day, new Strong Growth stocks can be found on ChartMill in our Strong Growth screener.
Our latest full fundamental report of LNTH contains the most current fundamental analsysis.
Our latest full technical report of LNTH contains the most current technical analsysis.
Disclaimer
This article should in no way be interpreted as advice. The article is based on the observed metrics at the time of writing, but you should always make your own analysis and trade or invest at your own responsibility.
101.32
+0.8 (+0.8%)
Find more stocks in the Stock Screener
LNTH Latest News and Analysis
 11 days ago - ChartmillLANTHEUS HOLDINGS INC (NASDAQ:LNTH), a growth stock which is not overvalued.
Discover LANTHEUS HOLDINGS INC, an undervalued growth gem. NASDAQ:LNTH is shining in terms of growth metrics, and it's also displaying strong financial health and profitability, retaining an appealing valuation.
