NASDAQ:LIVN appears to be flying under the radar despite its strong fundamentals.
By Mill Chart
Last update: Feb 26, 2025
Discover LIVANOVA PLC (NASDAQ:LIVN)—an undervalued stock our stock screener has picked out. NASDAQ:LIVN demonstrates solid fundamentals, including health and profitability, all while staying attractively priced. Let's explore the details.
Exploring NASDAQ:LIVN's Valuation
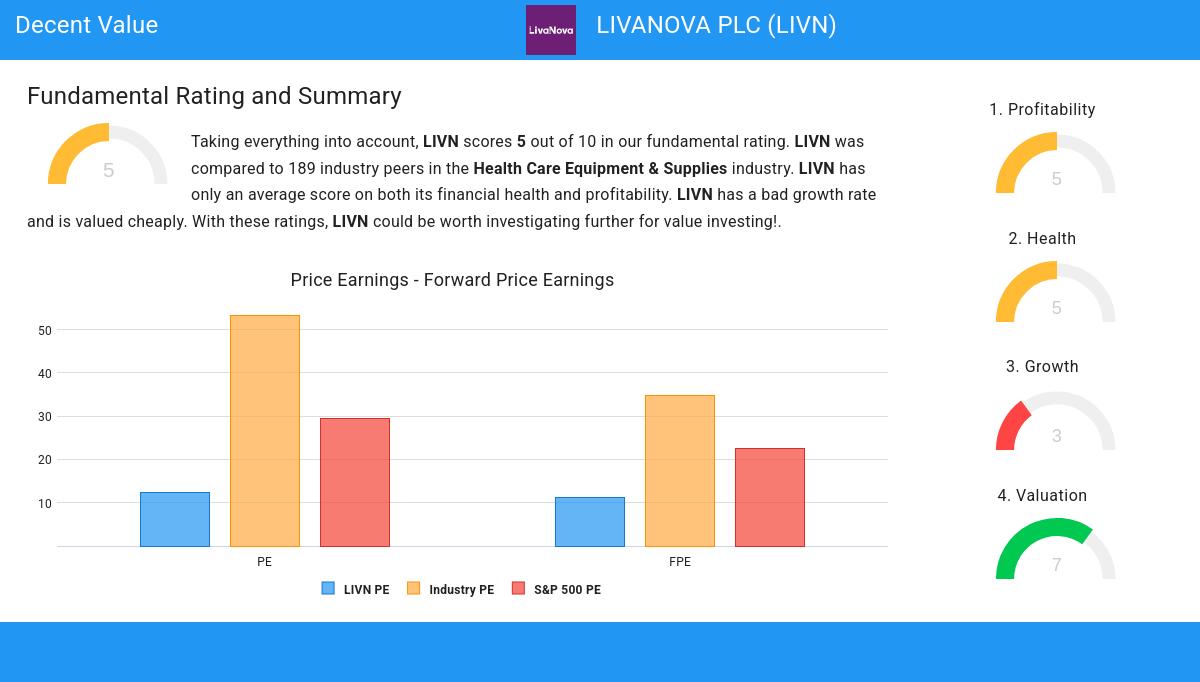
ChartMill employs its own Valuation Rating system for all stocks. This score, ranging from 0 to 10, is determined by evaluating different valuation factors, including price to earnings and free cash flow, both in absolute terms and relative to the market and industry. NASDAQ:LIVN has earned a 7 for valuation:
- 95.19% of the companies in the same industry are more expensive than LIVN, based on the Price/Earnings ratio.
- LIVN's Price/Earnings ratio indicates a rather cheap valuation when compared to the S&P500 average which is at 29.43.
- A Price/Forward Earnings ratio of 11.26 indicates a reasonable valuation of LIVN.
- Based on the Price/Forward Earnings ratio, LIVN is valued cheaply inside the industry as 96.26% of the companies are valued more expensively.
- When comparing the Price/Forward Earnings ratio of LIVN to the average of the S&P500 Index (22.65), we can say LIVN is valued rather cheaply.
- 84.49% of the companies in the same industry are more expensive than LIVN, based on the Enterprise Value to EBITDA ratio.
- LIVN's Price/Free Cash Flow ratio is rather cheap when compared to the industry. LIVN is cheaper than 88.77% of the companies in the same industry.
Looking at the Profitability
Discover ChartMill's exclusive Profitability Rating, a proprietary metric that assesses stocks on a scale of 0 to 10. It takes into consideration various profitability ratios and margins, both in absolute terms and relative to industry peers. Notably, NASDAQ:LIVN has achieved a 5:
- With a decent Return On Assets value of 0.94%, LIVN is doing good in the industry, outperforming 72.19% of the companies in the same industry.
- With a decent Return On Equity value of 1.81%, LIVN is doing good in the industry, outperforming 74.33% of the companies in the same industry.
- LIVN has a Return On Invested Capital of 4.79%. This is in the better half of the industry: LIVN outperforms 77.54% of its industry peers.
- The last Return On Invested Capital (4.79%) for LIVN is above the 3 year average (2.61%), which is a sign of increasing profitability.
- LIVN has a Profit Margin of 1.91%. This is in the better half of the industry: LIVN outperforms 72.73% of its industry peers.
- With a decent Operating Margin value of 10.74%, LIVN is doing good in the industry, outperforming 78.61% of the companies in the same industry.
- The Gross Margin of LIVN (67.78%) is better than 74.33% of its industry peers.
How do we evaluate the Health for NASDAQ:LIVN?
A critical element of ChartMill's stock evaluation is the Health Rating, which spans from 0 to 10. This rating considers multiple health factors, including liquidity and solvency, both in absolute terms and relative to industry peers. NASDAQ:LIVN has received a 5 out of 10:
- With a decent Debt to FCF ratio value of 5.76, LIVN is doing good in the industry, outperforming 77.54% of the companies in the same industry.
- LIVN has a Debt/Equity ratio of 0.46. This is a healthy value indicating a solid balance between debt and equity.
- LIVN has a Current Ratio of 3.37. This indicates that LIVN is financially healthy and has no problem in meeting its short term obligations.
- LIVN has a Quick Ratio of 2.87. This indicates that LIVN is financially healthy and has no problem in meeting its short term obligations.
- LIVN has a Quick ratio of 2.87. This is in the better half of the industry: LIVN outperforms 62.03% of its industry peers.
Growth Assessment of NASDAQ:LIVN
ChartMill employs its own Growth Rating system for all stocks. This score, ranging from 0 to 10, is derived by evaluating different growth factors, such as EPS and revenue growth, taking into account both past performance and future projections. NASDAQ:LIVN has earned a 3 for growth:
- LIVN shows a strong growth in Earnings Per Share. In the last year, the EPS has been growing by 19.93%, which is quite good.
- The Earnings Per Share is expected to grow by 10.69% on average over the next years. This is quite good.
- When comparing the EPS growth rate of the last years to the growth rate of the upcoming years, we see that the growth is accelerating.
Every day, new Decent Value stocks can be found on ChartMill in our Decent Value screener.
Check the latest full fundamental report of LIVN for a complete fundamental analysis.
Keep in mind
This is not investing advice! The article highlights some of the observations at the time of writing, but you should always make your own analysis and invest based on your own insights.
NASDAQ:LIVN (4/25/2025, 11:43:57 AM)
36.85
-0.41 (-1.1%)
Find more stocks in the Stock Screener
LIVN Latest News and Analysis
 8 days ago - ChartmillIn a market where value is scarce, LIVANOVA PLC (NASDAQ:LIVN) offers a refreshing opportunity with its solid fundamentals.
When you look at LIVANOVA PLC (NASDAQ:LIVN), it's hard to ignore the strong fundamentals, especially considering its likely undervaluation.
