
Why KT CORP-SP ADR (NYSE:KT) qualifies as a good dividend investing stock.
By Mill Chart
Last update: Feb 27, 2025
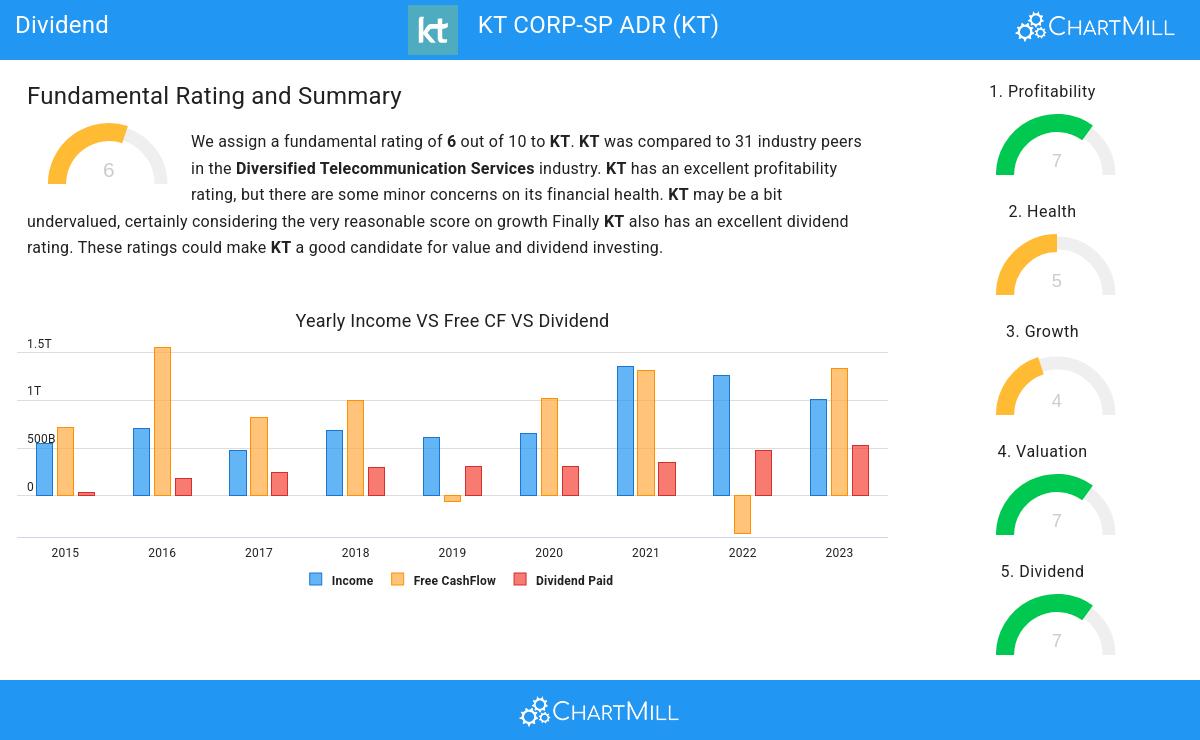
Our stock screening tool has identified KT CORP-SP ADR (NYSE:KT) as a strong dividend contender with robust fundamentals. NYSE:KT exhibits commendable financial health and profitability, all while offering a sustainable dividend. Let's delve into each aspect below.
Unpacking NYSE:KT's Dividend Rating
ChartMill employs its own Dividend Rating system for all stocks. This score, on a scale of 0 to 10, is determined by evaluating different dividend factors, such as yield, historical performance, dividend growth, and sustainability. NYSE:KT has been assigned a 7 for dividend:
- KT has a Yearly Dividend Yield of 4.20%, which is a nice return.
- Compared to an average industry Dividend Yield of 4.81, KT pays a bit more dividend than its industry peers.
- Compared to an average S&P500 Dividend Yield of 2.27, KT pays a better dividend.
- The dividend of KT is nicely growing with an annual growth rate of 11.46%!
- KT has been paying a dividend for at least 10 years, so it has a reliable track record.
- The dividend of KT is growing, but earnings are growing more, so the dividend growth is sustainable.
Exploring NYSE:KT's Health
ChartMill assigns a proprietary Health Rating to each stock. The score is computed by evaluating various liquidity and solvency ratios and ranges from 0 to 10. NYSE:KT was assigned a score of 5 for health:
- Looking at the Altman-Z score, with a value of 1.54, KT belongs to the top of the industry, outperforming 83.33% of the companies in the same industry.
- KT's Debt to FCF ratio of 5.87 is amongst the best of the industry. KT outperforms 83.33% of its industry peers.
- KT has a Debt/Equity ratio of 0.38. This is a healthy value indicating a solid balance between debt and equity.
- KT has a better Debt to Equity ratio (0.38) than 80.00% of its industry peers.
Understanding NYSE:KT's Profitability
ChartMill employs its own Profitability Rating system for stock evaluation. This score, ranging from 0 to 10, is derived from an analysis of diverse profitability metrics and margins. In the case of NYSE:KT, the assigned 7 is noteworthy for profitability:
- KT has a Return On Assets of 2.76%. This is in the better half of the industry: KT outperforms 73.33% of its industry peers.
- KT has a better Return On Equity (6.81%) than 63.33% of its industry peers.
- With a decent Return On Invested Capital value of 4.49%, KT is doing good in the industry, outperforming 63.33% of the companies in the same industry.
- The 3 year average ROIC (4.21%) for KT is below the current ROIC(4.49%), indicating increased profibility in the last year.
- In the last couple of years the Profit Margin of KT has grown nicely.
- KT's Operating Margin has improved in the last couple of years.
- Looking at the Gross Margin, with a value of 64.83%, KT is in the better half of the industry, outperforming 73.33% of the companies in the same industry.
- KT's Gross Margin has improved in the last couple of years.
Every day, new Best Dividend stocks can be found on ChartMill in our Best Dividend screener.
Our latest full fundamental report of KT contains the most current fundamental analsysis.
Disclaimer
Important Note: The content of this article is not intended as trading advice. It is essential to perform your own analysis and exercise caution when making trading decisions. The article presents observations created by automated analysis but does not guarantee any trading or investment outcomes. Always trade responsibly and make independent judgments.
