
Is NYSE:KT suited for dividend investing?
By Mill Chart
Last update: Feb 6, 2025
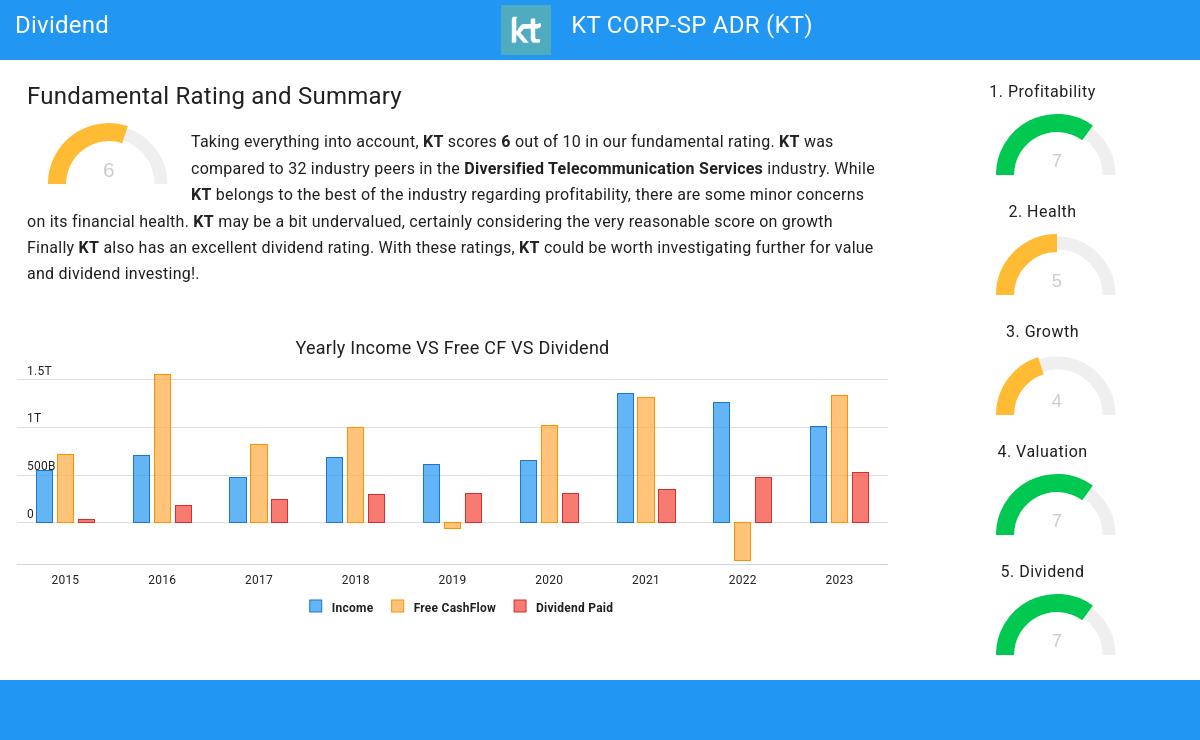
Take a closer look at KT CORP-SP ADR (NYSE:KT), a stock of interest to dividend investors uncovered by our stock screener. NYSE:KT excels in fundamentals and provides a decent dividend, all while maintaining a reasonable valuation. Let's break it down further.
What does the Dividend looks like for NYSE:KT
ChartMill employs its own Dividend Rating system for all stocks. This score, on a scale of 0 to 10, is determined by evaluating different dividend factors, such as yield, historical performance, dividend growth, and sustainability. NYSE:KT has been assigned a 7 for dividend:
- KT has a Yearly Dividend Yield of 7.36%, which is a nice return.
- KT's Dividend Yield is rather good when compared to the industry average which is at 5.20. KT pays more dividend than 90.32% of the companies in the same industry.
- KT's Dividend Yield is rather good when compared to the S&P500 average which is at 2.28.
- The dividend of KT is nicely growing with an annual growth rate of 11.46%!
- KT has been paying a dividend for at least 10 years, so it has a reliable track record.
- The dividend of KT is growing, but earnings are growing more, so the dividend growth is sustainable.
Understanding NYSE:KT's Health Score
Every stock is evaluated by ChartMill, receiving a Health Rating on a scale of 0 to 10. This assessment considers different health aspects, including liquidity and solvency, both in absolute terms and relative to industry peers. NYSE:KT has achieved a 5 out of 10:
- With an excellent Altman-Z score value of 1.54, KT belongs to the best of the industry, outperforming 83.87% of the companies in the same industry.
- KT has a better Debt to FCF ratio (5.87) than 83.87% of its industry peers.
- KT has a Debt/Equity ratio of 0.38. This is a healthy value indicating a solid balance between debt and equity.
- Looking at the Debt to Equity ratio, with a value of 0.38, KT is in the better half of the industry, outperforming 77.42% of the companies in the same industry.
Profitability Examination for NYSE:KT
Discover ChartMill's exclusive Profitability Rating, a proprietary metric that assesses stocks on a scale of 0 to 10. It takes into consideration various profitability ratios and margins, both in absolute terms and relative to industry peers. Notably, NYSE:KT has achieved a 7:
- Looking at the Return On Assets, with a value of 2.76%, KT is in the better half of the industry, outperforming 74.19% of the companies in the same industry.
- KT's Return On Equity of 6.81% is fine compared to the rest of the industry. KT outperforms 64.52% of its industry peers.
- The Return On Invested Capital of KT (4.49%) is better than 64.52% of its industry peers.
- The 3 year average ROIC (4.21%) for KT is below the current ROIC(4.49%), indicating increased profibility in the last year.
- Looking at the Profit Margin, with a value of 4.44%, KT is in the better half of the industry, outperforming 61.29% of the companies in the same industry.
- KT's Profit Margin has improved in the last couple of years.
- KT's Operating Margin has improved in the last couple of years.
- With a decent Gross Margin value of 64.83%, KT is doing good in the industry, outperforming 74.19% of the companies in the same industry.
- KT's Gross Margin has improved in the last couple of years.
More Best Dividend stocks can be found in our Best Dividend screener.
Our latest full fundamental report of KT contains the most current fundamental analsysis.
Disclaimer
Important Note: The content of this article is not intended as trading advice. It is essential to perform your own analysis and exercise caution when making trading decisions. The article presents observations created by automated analysis but does not guarantee any trading or investment outcomes. Always trade responsibly and make independent judgments.
