
Analyzing NYSE:KT's Dividend Potential.
By Mill Chart
Last update: Sep 27, 2024
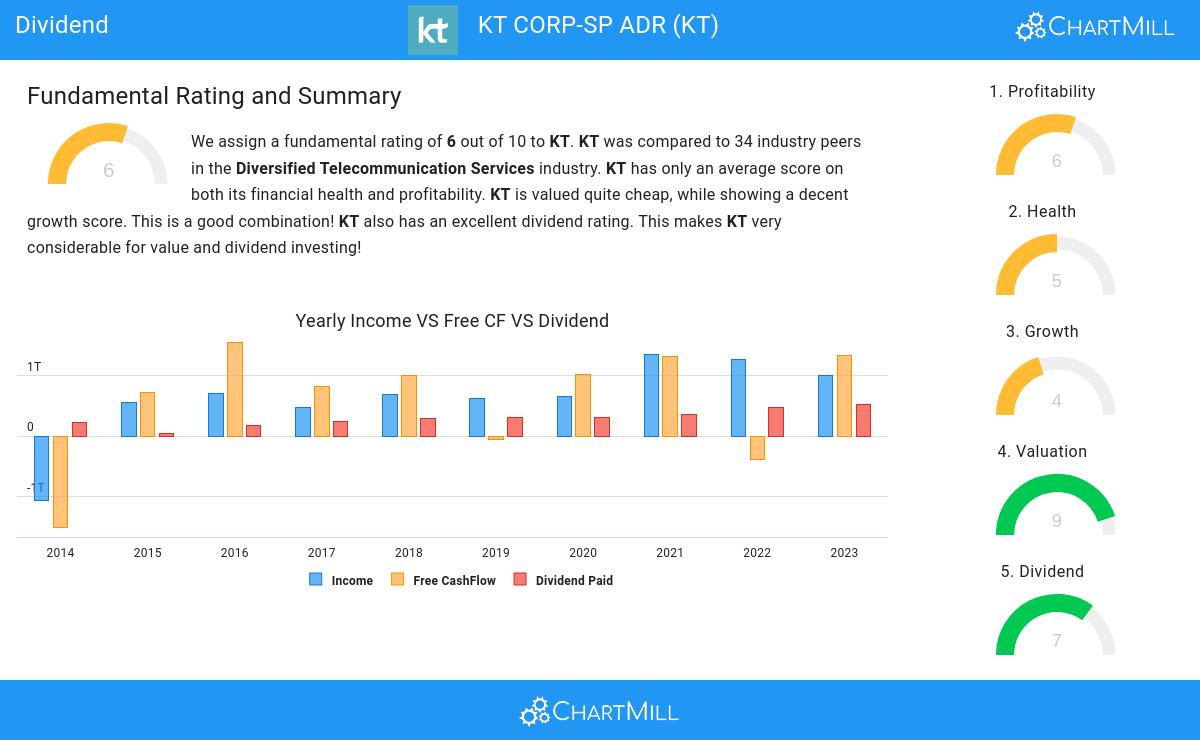
Discover KT CORP-SP ADR (NYSE:KT)—a stock that our stock screener has recognized as a solid dividend pick with strong fundamentals. NYSE:KT showcases decent financial health and profitability while providing a sustainable dividend. We'll explore the specifics further.
Unpacking NYSE:KT's Dividend Rating
ChartMill assigns a Dividend Rating to every stock. This score ranges from 0 to 10 and evaluates the different dividend aspects, including the yield, the growth and sustainability. NYSE:KT scores a 7 out of 10:
- KT has a Yearly Dividend Yield of 7.10%, which is a nice return.
- Compared to an average industry Dividend Yield of 4.76, KT pays a better dividend. On top of this KT pays more dividend than 94.12% of the companies listed in the same industry.
- Compared to an average S&P500 Dividend Yield of 2.21, KT pays a better dividend.
- On average, the dividend of KT grows each year by 11.46%, which is quite nice.
- KT has been paying a dividend for at least 10 years, so it has a reliable track record.
Health Analysis for NYSE:KT
Every stock is evaluated by ChartMill, receiving a Health Rating on a scale of 0 to 10. This assessment considers different health aspects, including liquidity and solvency, both in absolute terms and relative to industry peers. NYSE:KT has achieved a 5 out of 10:
- With an excellent Altman-Z score value of 1.47, KT belongs to the best of the industry, outperforming 82.35% of the companies in the same industry.
- KT's Debt to FCF ratio of 4.52 is amongst the best of the industry. KT outperforms 85.29% of its industry peers.
- A Debt/Equity ratio of 0.46 indicates that KT is not too dependend on debt financing.
- KT's Debt to Equity ratio of 0.46 is fine compared to the rest of the industry. KT outperforms 76.47% of its industry peers.
Exploring NYSE:KT's Profitability
Discover ChartMill's exclusive Profitability Rating, a proprietary metric that assesses stocks on a scale of 0 to 10. It takes into consideration various profitability ratios and margins, both in absolute terms and relative to industry peers. Notably, NYSE:KT has achieved a 6:
- Looking at the Return On Assets, with a value of 2.52%, KT is in the better half of the industry, outperforming 64.71% of the companies in the same industry.
- KT's Profit Margin has improved in the last couple of years.
- KT's Operating Margin has improved in the last couple of years.
- KT has a Gross Margin of 64.59%. This is in the better half of the industry: KT outperforms 76.47% of its industry peers.
- In the last couple of years the Gross Margin of KT has grown nicely.
More Best Dividend stocks can be found in our Best Dividend screener.
Check the latest full fundamental report of KT for a complete fundamental analysis.
Keep in mind
This article should in no way be interpreted as advice. The article is based on the observed metrics at the time of writing, but you should always make your own analysis and trade or invest at your own responsibility.