
Exploring NYSE:KMB's dividend characteristics.
By Mill Chart
Last update: Oct 18, 2024
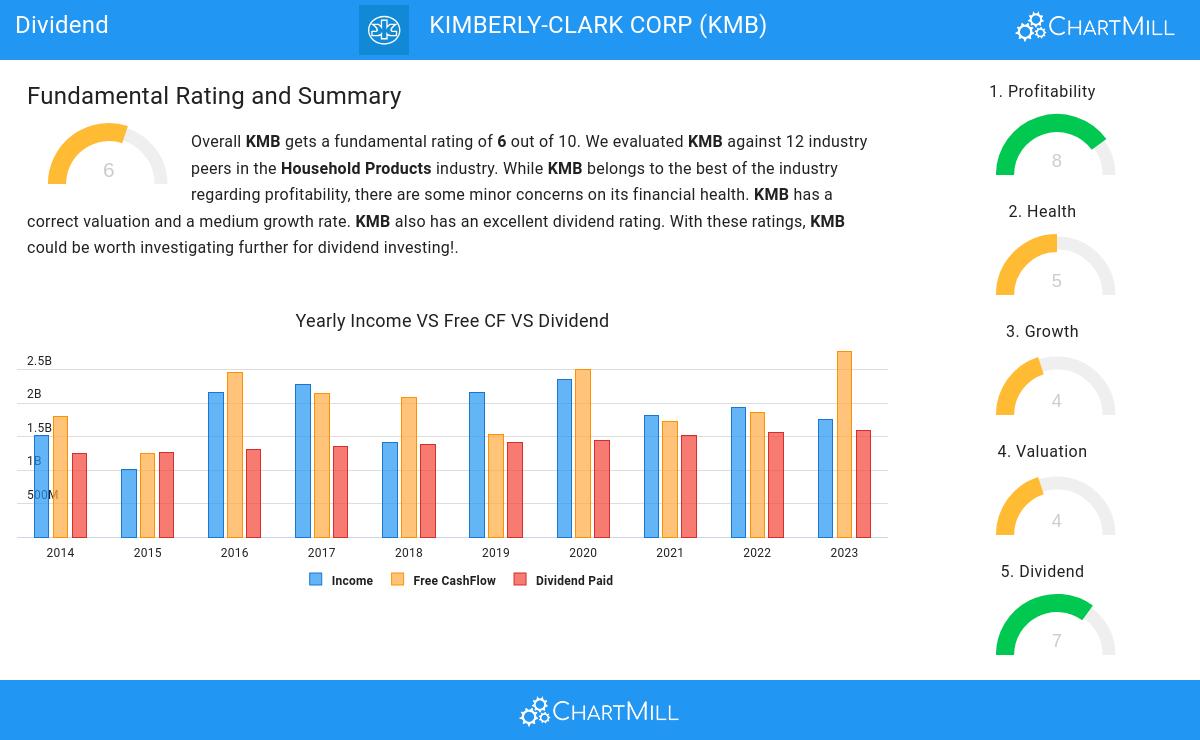
KIMBERLY-CLARK CORP (NYSE:KMB) was identified as a stock worth exploring by dividend investors by our stock screener. NYSE:KMB scores well on profitability, solvency and liquidity. At the same time it seems to pay a decent dividend. We'll explore this a bit deeper below.
Dividend Analysis for NYSE:KMB
ChartMill assigns a proprietary Dividend Rating to each stock. The score is computed by evaluating various valuation aspects, like the yield, the history, the dividend growth and sustainability. NYSE:KMB was assigned a score of 7 for dividend:
- Compared to an average industry Dividend Yield of 2.41, KMB pays a better dividend. On top of this KMB pays more dividend than 91.67% of the companies listed in the same industry.
- KMB's Dividend Yield is rather good when compared to the S&P500 average which is at 2.21.
- KMB has paid a dividend for at least 10 years, which is a reliable track record.
- KMB has not decreased its dividend for at least 10 years, so it has a reliable track record of non decreasing dividend.
- KMB's earnings are growing more than its dividend. This makes the dividend growth sustainable.
Health Assessment of NYSE:KMB
ChartMill employs its own Health Rating for stock assessment. This rating, ranging from 0 to 10, is calculated by examining various liquidity and solvency ratios. In the case of NYSE:KMB, the assigned 5 reflects its health status:
- KMB has an Altman-Z score of 4.24. This indicates that KMB is financially healthy and has little risk of bankruptcy at the moment.
- KMB has a better Altman-Z score (4.24) than 66.67% of its industry peers.
- KMB has a debt to FCF ratio of 2.78. This is a good value and a sign of high solvency as KMB would need 2.78 years to pay back of all of its debts.
- KMB's Debt to FCF ratio of 2.78 is fine compared to the rest of the industry. KMB outperforms 66.67% of its industry peers.
A Closer Look at Profitability for NYSE:KMB
ChartMill assigns a proprietary Profitability Rating to each stock. The score is computed by evaluating various profitability ratios and margins and ranges from 0 to 10. NYSE:KMB was assigned a score of 8 for profitability:
- KMB has a better Return On Assets (13.23%) than 75.00% of its industry peers.
- With an excellent Return On Equity value of 201.32%, KMB belongs to the best of the industry, outperforming 91.67% of the companies in the same industry.
- The Return On Invested Capital of KMB (24.27%) is better than 91.67% of its industry peers.
- KMB had an Average Return On Invested Capital over the past 3 years of 20.65%. This is significantly above the industry average of 14.46%.
- The last Return On Invested Capital (24.27%) for KMB is above the 3 year average (20.65%), which is a sign of increasing profitability.
- With a decent Profit Margin value of 11.28%, KMB is doing good in the industry, outperforming 66.67% of the companies in the same industry.
- In the last couple of years the Profit Margin of KMB has grown nicely.
- With a decent Operating Margin value of 15.71%, KMB is doing good in the industry, outperforming 66.67% of the companies in the same industry.
More Best Dividend stocks can be found in our Best Dividend screener.
Our latest full fundamental report of KMB contains the most current fundamental analsysis.
Keep in mind
This is not investing advice! The article highlights some of the observations at the time of writing, but you should always make your own analysis and invest based on your own insights.
132.34
-1.06 (-0.79%)
Find more stocks in the Stock Screener
KMB Latest News and Analysis
 a day ago - ChartmillStay informed with the top movers within the S&P500 index on Wednesday.
Get insights into the S&P500 index performance on Wednesday. Explore the top gainers and losers within the S&P500 index in today's session.
2 days ago - ChartmillExplore the top gainers and losers within the S&P500 index in today's session.Wondering what's happening in today's session for the S&P500 index? Stay informed with the top movers within the S&P500 index on Wednesday.
 2 days ago - ChartmillWhich S&P500 stocks are gapping on Wednesday?
Curious about the S&P500 stocks that are gapping on Wednesday? Explore the gap up and gap down stocks in the S&P500 index during today's session.
2 days ago - ChartmillWhich S&P500 stocks are moving on Tuesday?Curious about the top performers within the S&P500 index one hour before the close of the markets on Tuesday? Dive into the list of today's session's top gainers and losers for a comprehensive overview.
3 days ago - ChartmillExploring the top movers within the S&P500 index during today's session.Stay updated with the movements of the S&P500 index in the middle of the day on Tuesday. Discover which stocks are leading as top gainers and losers in today's session.
3 days ago - ChartmillWhich S&P500 stocks are gapping on Tuesday?Curious about the market action on Tuesday? Dive into the US markets to explore the gap up and gap down stocks in the S&P500 index during today's session.
 3 days ago - ChartmillTop S&P500 movers in Tuesday's pre-market session
Curious about the S&P500 stocks that are showing activity before the opening bell on Tuesday?
