
Why NYSE:KMB is a Top Pick for Dividend Investors.
By Mill Chart
Last update: Sep 26, 2024
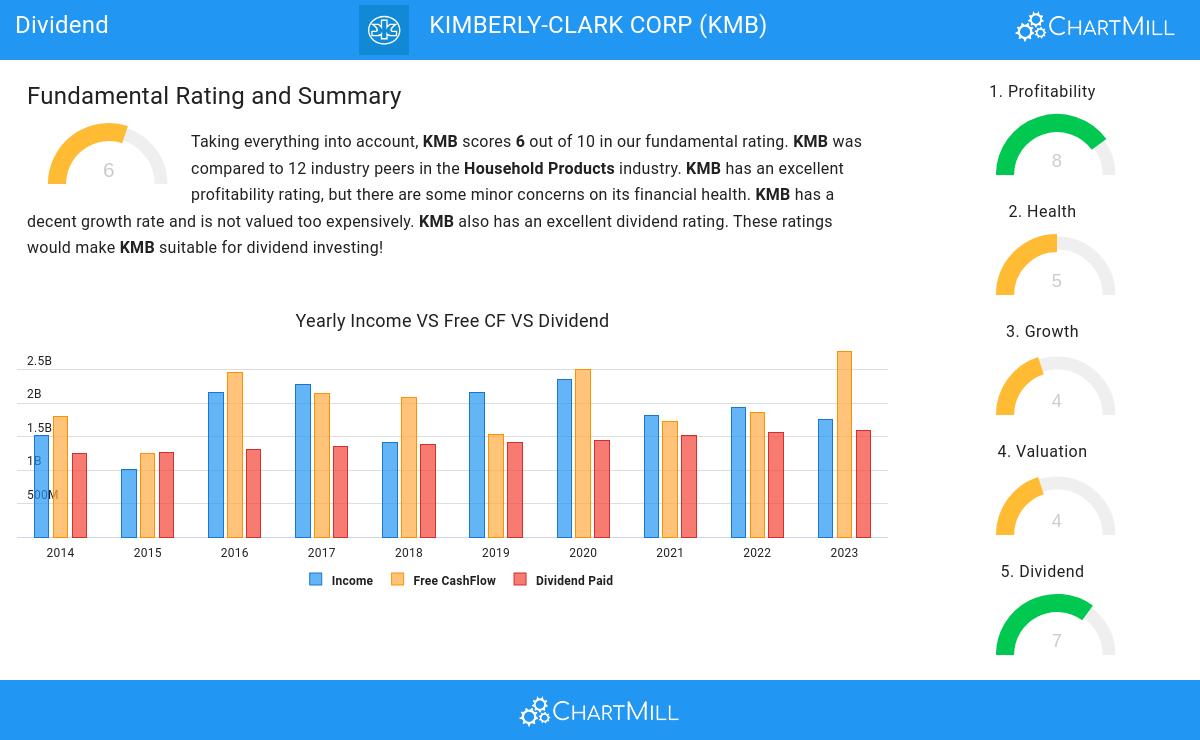
Our stock screener has spotted KIMBERLY-CLARK CORP (NYSE:KMB) as a good dividend stock with solid fundamentals. NYSE:KMB shows decent health and profitability. At the same time it gives a good and sustainable dividend. We'll dive into each aspect below.
Dividend Insights: NYSE:KMB
To gauge a stock's dividend quality, ChartMill utilizes a Dividend Rating ranging from 0 to 10. This comprehensive assessment considers various dividend aspects, including yield, history, growth, and sustainability. NYSE:KMB has achieved a 7 out of 10:
- KMB's Dividend Yield is rather good when compared to the industry average which is at 2.39. KMB pays more dividend than 91.67% of the companies in the same industry.
- Compared to an average S&P500 Dividend Yield of 2.21, KMB pays a better dividend.
- KMB has been paying a dividend for at least 10 years, so it has a reliable track record.
- KMB has not decreased their dividend for at least 10 years, which is a reliable track record.
- KMB's earnings are growing more than its dividend. This makes the dividend growth sustainable.
Deciphering NYSE:KMB's Health Rating
ChartMill assigns a Health Rating to every stock. This score ranges from 0 to 10 and evaluates the different health aspects like liquidity and solvency, both absolutely, but also relative to the industry peers. NYSE:KMB scores a 5 out of 10:
- An Altman-Z score of 4.18 indicates that KMB is not in any danger for bankruptcy at the moment.
- Looking at the Altman-Z score, with a value of 4.18, KMB is in the better half of the industry, outperforming 66.67% of the companies in the same industry.
- KMB has a debt to FCF ratio of 2.78. This is a good value and a sign of high solvency as KMB would need 2.78 years to pay back of all of its debts.
- The Debt to FCF ratio of KMB (2.78) is better than 66.67% of its industry peers.
What does the Profitability looks like for NYSE:KMB
ChartMill employs its own Profitability Rating system for stock evaluation. This score, ranging from 0 to 10, is derived from an analysis of diverse profitability metrics and margins. In the case of NYSE:KMB, the assigned 8 is noteworthy for profitability:
- The Return On Assets of KMB (13.23%) is better than 75.00% of its industry peers.
- KMB's Return On Equity of 201.32% is amongst the best of the industry. KMB outperforms 91.67% of its industry peers.
- KMB has a better Return On Invested Capital (24.27%) than 91.67% of its industry peers.
- The Average Return On Invested Capital over the past 3 years for KMB is significantly above the industry average of 14.51%.
- The last Return On Invested Capital (24.27%) for KMB is above the 3 year average (20.65%), which is a sign of increasing profitability.
- KMB's Profit Margin of 11.28% is fine compared to the rest of the industry. KMB outperforms 66.67% of its industry peers.
- KMB's Profit Margin has improved in the last couple of years.
- KMB has a Operating Margin of 15.71%. This is in the better half of the industry: KMB outperforms 66.67% of its industry peers.
Our Best Dividend screener lists more Best Dividend stocks and is updated daily.
Our latest full fundamental report of KMB contains the most current fundamental analsysis.
Keep in mind
Important Note: The content of this article is not intended as trading advice. It is essential to perform your own analysis and exercise caution when making trading decisions. The article presents observations created by automated analysis but does not guarantee any trading or investment outcomes. Always trade responsibly and make independent judgments.
NYSE:KMB (4/25/2025, 11:38:01 AM)
130.375
-1.97 (-1.48%)
Find more stocks in the Stock Screener
KMB Latest News and Analysis
 2 days ago - ChartmillStay informed with the top movers within the S&P500 index on Wednesday.
Get insights into the S&P500 index performance on Wednesday. Explore the top gainers and losers within the S&P500 index in today's session.
2 days ago - ChartmillExplore the top gainers and losers within the S&P500 index in today's session.Wondering what's happening in today's session for the S&P500 index? Stay informed with the top movers within the S&P500 index on Wednesday.
 2 days ago - ChartmillWhich S&P500 stocks are gapping on Wednesday?
Curious about the S&P500 stocks that are gapping on Wednesday? Explore the gap up and gap down stocks in the S&P500 index during today's session.
3 days ago - ChartmillWhich S&P500 stocks are moving on Tuesday?Curious about the top performers within the S&P500 index one hour before the close of the markets on Tuesday? Dive into the list of today's session's top gainers and losers for a comprehensive overview.
3 days ago - ChartmillExploring the top movers within the S&P500 index during today's session.Stay updated with the movements of the S&P500 index in the middle of the day on Tuesday. Discover which stocks are leading as top gainers and losers in today's session.
3 days ago - ChartmillWhich S&P500 stocks are gapping on Tuesday?Curious about the market action on Tuesday? Dive into the US markets to explore the gap up and gap down stocks in the S&P500 index during today's session.
 3 days ago - ChartmillTop S&P500 movers in Tuesday's pre-market session
Curious about the S&P500 stocks that are showing activity before the opening bell on Tuesday?
