
NASDAQ:KLAC, a growth stock which is not overvalued.
By Mill Chart
Last update: Feb 3, 2025
Our stock screening tool has pinpointed KLA CORP (NASDAQ:KLAC) as a growth stock that isn't overvalued. NASDAQ:KLAC is excelling in various growth indicators while maintaining a solid financial footing. Furthermore, it remains attractively priced. Let's delve into the specifics below.
Assessing Growth Metrics for NASDAQ:KLAC
ChartMill employs its own Growth Rating system for all stocks. This score, ranging from 0 to 10, is derived by evaluating different growth factors, such as EPS and revenue growth, taking into account both past performance and future projections. NASDAQ:KLAC has earned a 7 for growth:
- The Earnings Per Share has grown by an impressive 20.18% over the past year.
- The Earnings Per Share has been growing by 22.88% on average over the past years. This is a very strong growth
- KLAC shows quite a strong growth in Revenue. In the last year, the Revenue has grown by 12.15%.
- KLAC shows quite a strong growth in Revenue. Measured over the last years, the Revenue has been growing by 16.52% yearly.
- Based on estimates for the next years, KLAC will show a quite strong growth in Earnings Per Share. The EPS will grow by 13.95% on average per year.
- KLAC is expected to show quite a strong growth in Revenue. In the coming years, the Revenue will grow by 9.68% yearly.
Assessing Valuation for NASDAQ:KLAC
An integral part of ChartMill's stock analysis is the Valuation Rating, which spans from 0 to 10. This rating evaluates diverse valuation factors, including price to earnings and cash flows, while considering the stock's profitability and growth. NASDAQ:KLAC has received a 6 out of 10:
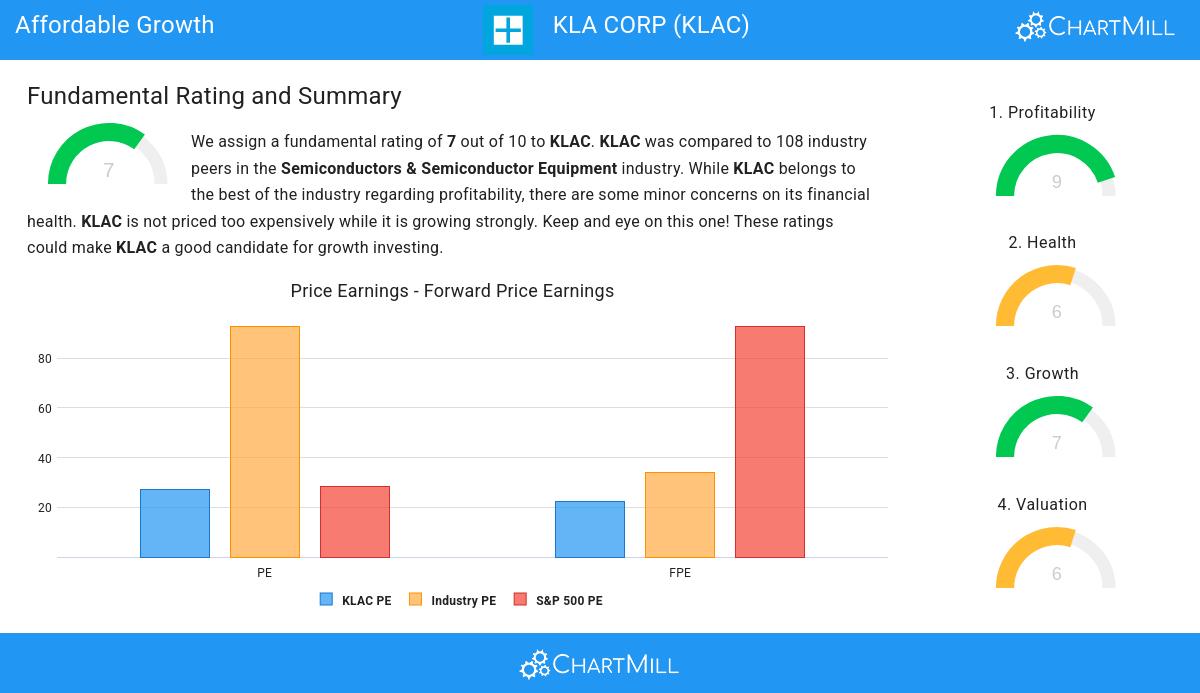
- Compared to the rest of the industry, the Price/Earnings ratio of KLAC indicates a somewhat cheap valuation: KLAC is cheaper than 72.22% of the companies listed in the same industry.
- 74.07% of the companies in the same industry are more expensive than KLAC, based on the Price/Forward Earnings ratio.
- KLAC's Price/Forward Earnings ratio indicates a rather cheap valuation when compared to the S&P500 average which is at 92.87.
- Compared to the rest of the industry, the Enterprise Value to EBITDA ratio of KLAC indicates a somewhat cheap valuation: KLAC is cheaper than 69.44% of the companies listed in the same industry.
- KLAC's Price/Free Cash Flow ratio is a bit cheaper when compared to the industry. KLAC is cheaper than 77.78% of the companies in the same industry.
- KLAC's low PEG Ratio(NY), which compensates the Price/Earnings for growth, indicates a rather cheap valuation of the company.
- KLAC has an outstanding profitability rating, which may justify a higher PE ratio.
- KLAC's earnings are expected to grow with 16.84% in the coming years. This may justify a more expensive valuation.
What does the Health looks like for NASDAQ:KLAC
Every stock is evaluated by ChartMill, receiving a Health Rating on a scale of 0 to 10. This assessment considers different health aspects, including liquidity and solvency, both in absolute terms and relative to industry peers. NASDAQ:KLAC has achieved a 6 out of 10:
- KLAC has an Altman-Z score of 7.44. This indicates that KLAC is financially healthy and has little risk of bankruptcy at the moment.
- KLAC's Altman-Z score of 7.44 is fine compared to the rest of the industry. KLAC outperforms 72.22% of its industry peers.
- KLAC has a debt to FCF ratio of 1.75. This is a very positive value and a sign of high solvency as it would only need 1.75 years to pay back of all of its debts.
- Looking at the Debt to FCF ratio, with a value of 1.75, KLAC is in the better half of the industry, outperforming 75.00% of the companies in the same industry.
- Even though the debt/equity ratio score it not favorable for KLAC, it has very limited outstanding debt, so we won't put too much weight on the DE evaluation.
- KLAC has a Current Ratio of 2.36. This indicates that KLAC is financially healthy and has no problem in meeting its short term obligations.
Profitability Analysis for NASDAQ:KLAC
ChartMill utilizes a Profitability Rating to assess stocks, scoring them on a scale of 0 to 10. This rating takes into account a variety of profitability ratios and margins, both in absolute terms and in comparison to industry peers. NASDAQ:KLAC has earned a 9 out of 10:
- KLAC's Return On Assets of 21.39% is amongst the best of the industry. KLAC outperforms 96.30% of its industry peers.
- KLAC's Return On Equity of 89.51% is amongst the best of the industry. KLAC outperforms 99.07% of its industry peers.
- KLAC has a better Return On Invested Capital (35.20%) than 98.15% of its industry peers.
- KLAC had an Average Return On Invested Capital over the past 3 years of 33.80%. This is significantly above the industry average of 11.95%.
- The 3 year average ROIC (33.80%) for KLAC is below the current ROIC(35.20%), indicating increased profibility in the last year.
- KLAC has a better Profit Margin (29.58%) than 91.67% of its industry peers.
- In the last couple of years the Profit Margin of KLAC has grown nicely.
- KLAC has a better Operating Margin (40.07%) than 97.22% of its industry peers.
- In the last couple of years the Operating Margin of KLAC has grown nicely.
- KLAC has a better Gross Margin (61.37%) than 87.04% of its industry peers.
More Affordable Growth stocks can be found in our Affordable Growth screener.
Check the latest full fundamental report of KLAC for a complete fundamental analysis.
Disclaimer
This article should in no way be interpreted as advice. The article is based on the observed metrics at the time of writing, but you should always make your own analysis and trade or invest at your own responsibility.