
A technical analysis of KRAFT HEINZ CO/THE.
By Mill Chart
Last update: Sep 10, 2024
Our stockscreener has identified a possible breakout setup on KRAFT HEINZ CO/THE (NASDAQ:KHC). This occurs when the stock consolidates following a significant upward movement. While the breakout outcome cannot be guaranteed, it may be worth monitoring NASDAQ:KHC for potential opportunities.
In-Depth Technical Analysis of NASDAQ:KHC
Every day ChartMill assigns a Technical Rating to every stock. The score ranges from 0 to 10 and is determined by evaluating multiple technical indicators and properties.
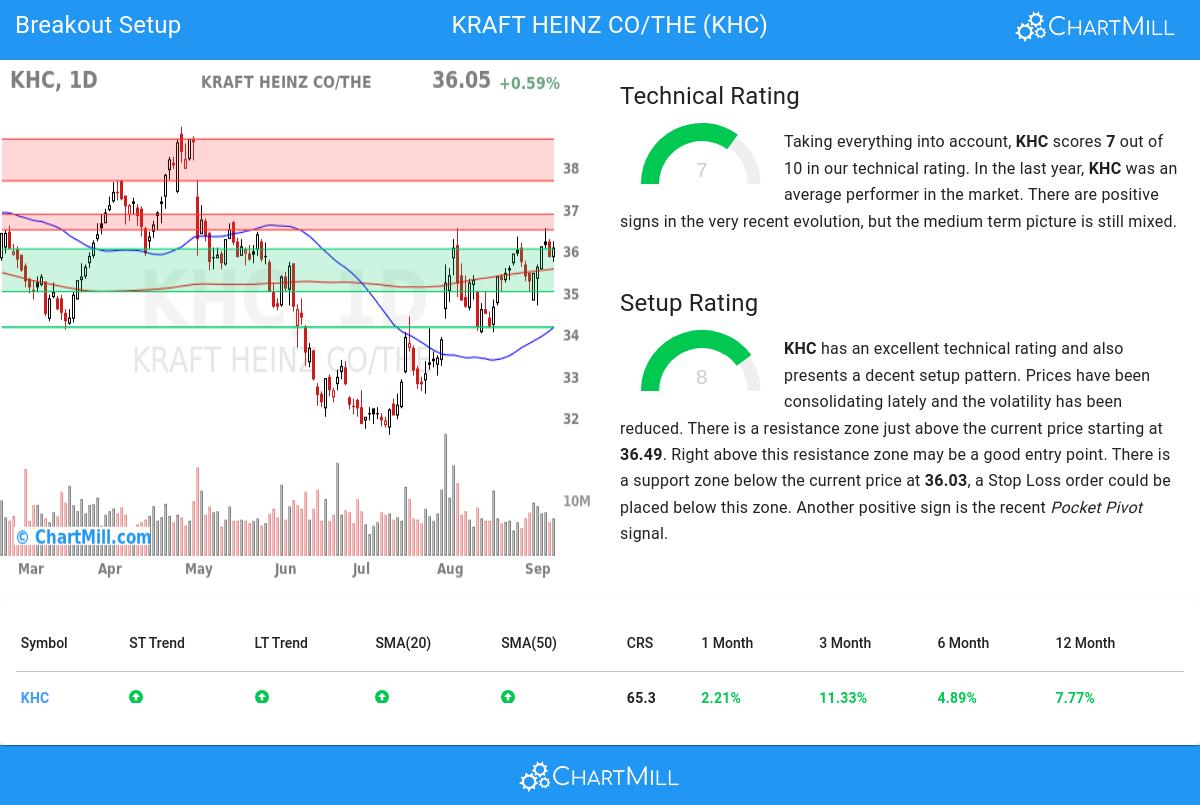
Overall KHC gets a technical rating of 7 out of 10. KHC has been a medium performer in the overall market. Some doubts are observed in the medium time frame, but recent action was very positive.
- Both the short term and long term trends are positive. This is a very positive sign.
- In the last month KHC has a been trading in the 34.00 - 36.53 range, which is quite wide. It is currently trading near the high of this range.
- When compared to the yearly performance of all other stocks, KHC outperforms 65% of them, which is more or less in line with the market.
- KHC is part of the Food Products industry. There are 91 other stocks in this industry, KHC did better than 65% of them.
- KHC is currently trading in the middle of its 52 week range. The S&P500 Index however is trading in the upper part of its 52 week range, so KHC is lagging the market slightly.
Check the latest full technical report of KHC for a complete technical analysis.
How does the Setup look for NASDAQ:KHC
In addition to the Technical Rating, ChartMill provides a Setup Rating for each stock. This rating, ranging from 0 to 10, assesses the extent of consolidation in the stock based on multiple short-term technical indicators. Currently, NASDAQ:KHC has a 8 as its setup rating:
Besides having an excellent technical rating, KHC also presents a decent setup pattern. Prices have been consolidating lately and the volatility has been reduced. There is a resistance zone just above the current price starting at 36.49. Right above this resistance zone may be a good entry point. There is a support zone below the current price at 36.03, a Stop Loss order could be placed below this zone. Very recently a Pocket Pivot signal was observed. This is another positive sign.
How can NASDAQ:KHC be traded?
A breakout could materialize when the stock breaks out to new highs above the current consolidation zone. One could wait for this to happen and buy when this happens. A stop loss could be placed below the consolidation zone.
Of course, there are many ways to trade or not trade NASDAQ:KHC and this article should in no way be interpreted as trading advice. The article is purely based on an automated technical analysis and just points out the technical observations. Always make your own analysis and trade at your own responsibility.
Our Breakout screener lists more breakout setups and is updated daily.
Disclaimer
This is not investing advice! The article highlights some of the observations at the time of writing, but you should always make your own analysis and invest based on your own insights.