
JOHNSON & JOHNSON (NYSE:JNJ) has caught the attention of our stock screener as a great value stock. NYSE:JNJ excels in profitability, solvency, and liquidity, all while being very reasonably priced. Let's delve into the details.
Understanding NYSE:JNJ's Valuation Score
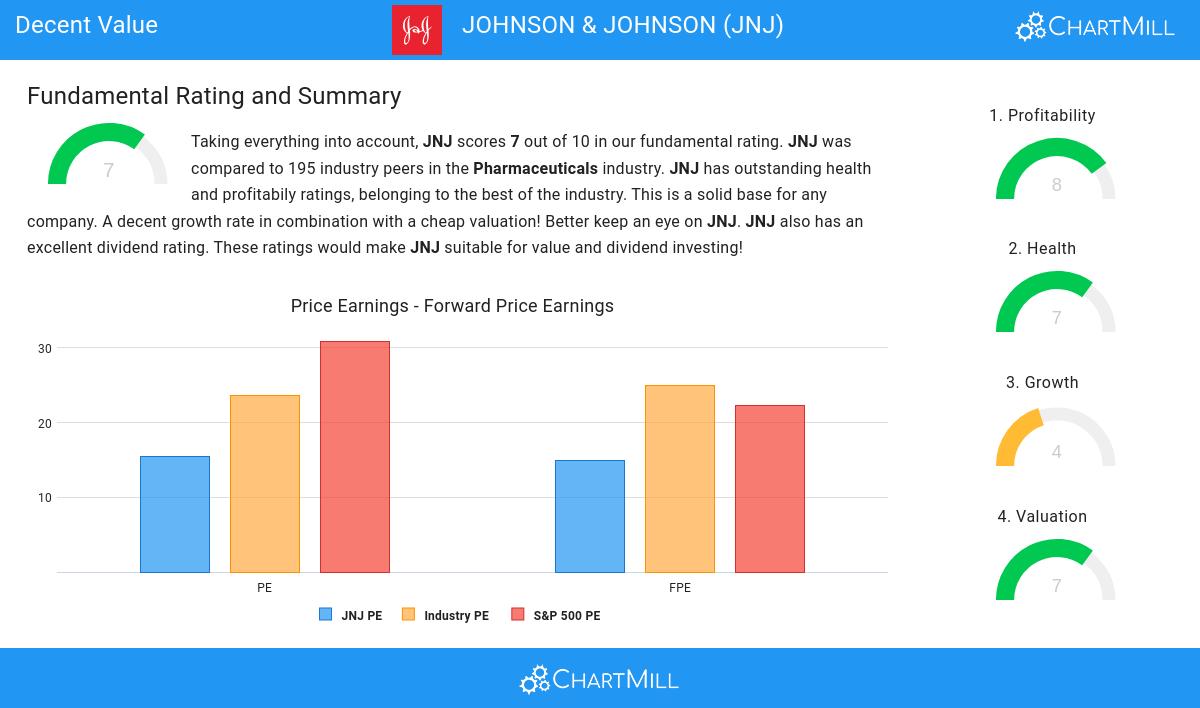
An integral part of ChartMill's stock analysis is the Valuation Rating, which spans from 0 to 10. This rating evaluates diverse valuation factors, including price to earnings and cash flows, while considering the stock's profitability and growth. NYSE:JNJ has received a 7 out of 10:
- Based on the Price/Earnings ratio, JNJ is valued cheaply inside the industry as 89.18% of the companies are valued more expensively.
- The average S&P500 Price/Earnings ratio is at 30.91. JNJ is valued rather cheaply when compared to this.
- Based on the Price/Forward Earnings ratio, JNJ is valued cheaply inside the industry as 82.47% of the companies are valued more expensively.
- When comparing the Price/Forward Earnings ratio of JNJ to the average of the S&P500 Index (22.30), we can say JNJ is valued slightly cheaper.
- 86.08% of the companies in the same industry are more expensive than JNJ, based on the Enterprise Value to EBITDA ratio.
- Compared to the rest of the industry, the Price/Free Cash Flow ratio of JNJ indicates a rather cheap valuation: JNJ is cheaper than 85.57% of the companies listed in the same industry.
- The excellent profitability rating of JNJ may justify a higher PE ratio.
Profitability Analysis for NYSE:JNJ
Discover ChartMill's exclusive Profitability Rating, a proprietary metric that assesses stocks on a scale of 0 to 10. It takes into consideration various profitability ratios and margins, both in absolute terms and relative to industry peers. Notably, NYSE:JNJ has achieved a 8:
- The Return On Assets of JNJ (20.99%) is better than 97.94% of its industry peers.
- JNJ's Return On Equity of 53.14% is amongst the best of the industry. JNJ outperforms 97.42% of its industry peers.
- JNJ has a Return On Invested Capital of 15.89%. This is amongst the best in the industry. JNJ outperforms 92.78% of its industry peers.
- The 3 year average ROIC (14.68%) for JNJ is below the current ROIC(15.89%), indicating increased profibility in the last year.
- With an excellent Profit Margin value of 43.91%, JNJ belongs to the best of the industry, outperforming 97.42% of the companies in the same industry.
- In the last couple of years the Profit Margin of JNJ has grown nicely.
- JNJ's Operating Margin of 28.78% is amongst the best of the industry. JNJ outperforms 94.33% of its industry peers.
- JNJ's Operating Margin has improved in the last couple of years.
- JNJ has a Gross Margin of 69.43%. This is in the better half of the industry: JNJ outperforms 73.20% of its industry peers.
Health Insights: NYSE:JNJ
To gauge a stock's financial health, ChartMill utilizes a Health Rating on a scale of 0 to 10. This comprehensive evaluation encompasses liquidity and solvency, both in absolute terms and in comparison to industry peers. NYSE:JNJ has earned a 7 out of 10:
- JNJ has an Altman-Z score of 4.29. This indicates that JNJ is financially healthy and has little risk of bankruptcy at the moment.
- With a decent Altman-Z score value of 4.29, JNJ is doing good in the industry, outperforming 77.84% of the companies in the same industry.
- The Debt to FCF ratio of JNJ is 2.04, which is a good value as it means it would take JNJ, 2.04 years of fcf income to pay off all of its debts.
- With an excellent Debt to FCF ratio value of 2.04, JNJ belongs to the best of the industry, outperforming 94.33% of the companies in the same industry.
- Although JNJ does not score too well on debt/equity it has very limited outstanding debt, which is well covered by the FCF. We will not put too much weight on the debt/equity number as it may be because of low equity, which could be a consequence of a share buyback program for instance. This needs to be investigated.
- JNJ does not score too well on the current and quick ratio evaluation. However, as it has excellent solvency and profitability, these ratios do not necessarly indicate liquidity issues and need to be evaluated against the specifics of the business.
Exploring NYSE:JNJ's Growth
A key component of ChartMill's stock assessment is the Growth Rating, which spans from 0 to 10. This rating evaluates diverse growth factors, such as EPS and revenue growth, considering both past performance and future projections. NYSE:JNJ has received a 4 out of 10:
- When comparing the Revenue growth rate of the last years to the growth rate of the upcoming years, we see that the growth is accelerating.
More Decent Value stocks can be found in our Decent Value screener.
Check the latest full fundamental report of JNJ for a complete fundamental analysis.
Disclaimer
Important Note: The content of this article is not intended as trading advice. It is essential to perform your own analysis and exercise caution when making trading decisions. The article presents observations created by automated analysis but does not guarantee any trading or investment outcomes. Always trade responsibly and make independent judgments.