
JOHNSON & JOHNSON (NYSE:JNJ) has caught the attention of dividend investors as a stock worth considering. NYSE:JNJ excels in profitability, solvency, and liquidity, all while providing a decent dividend. Let's delve into the details.
Evaluating Dividend: NYSE:JNJ
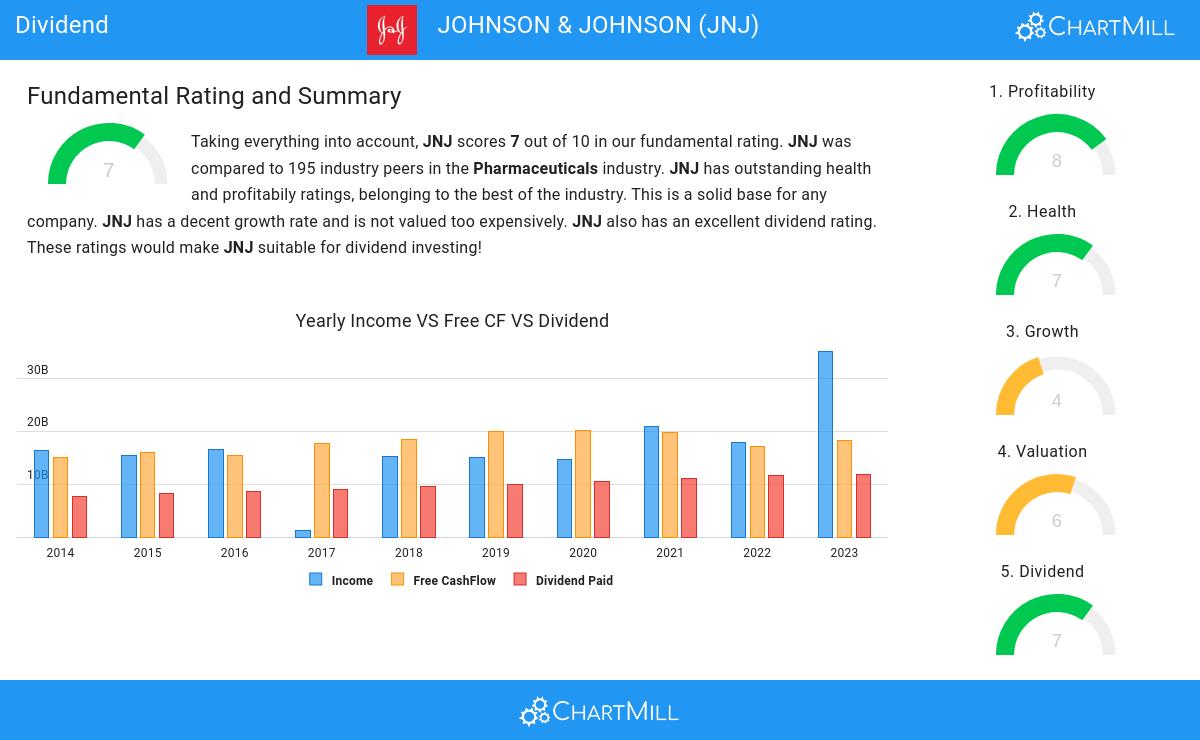
ChartMill employs its own Dividend Rating system for all stocks. This score, on a scale of 0 to 10, is determined by evaluating different dividend factors, such as yield, historical performance, dividend growth, and sustainability. NYSE:JNJ has been assigned a 7 for dividend:
- JNJ's Dividend Yield is rather good when compared to the industry average which is at 3.91. JNJ pays more dividend than 93.81% of the companies in the same industry.
- JNJ's Dividend Yield is a higher than the S&P500 average which is at 2.21.
- On average, the dividend of JNJ grows each year by 9.96%, which is quite nice.
- JNJ has paid a dividend for at least 10 years, which is a reliable track record.
- JNJ has not decreased its dividend for at least 10 years, so it has a reliable track record of non decreasing dividend.
- 30.49% of the earnings are spent on dividend by JNJ. This is a low number and sustainable payout ratio.
Evaluating Health: NYSE:JNJ
ChartMill employs a unique Health Rating system for all stocks. This rating, ranging from 0 to 10, is determined by analyzing various liquidity and solvency ratios. For NYSE:JNJ, the assigned 7 for health provides valuable insights:
- An Altman-Z score of 4.32 indicates that JNJ is not in any danger for bankruptcy at the moment.
- JNJ's Altman-Z score of 4.32 is fine compared to the rest of the industry. JNJ outperforms 77.84% of its industry peers.
- The Debt to FCF ratio of JNJ is 2.04, which is a good value as it means it would take JNJ, 2.04 years of fcf income to pay off all of its debts.
- Looking at the Debt to FCF ratio, with a value of 2.04, JNJ belongs to the top of the industry, outperforming 94.33% of the companies in the same industry.
- Even though the debt/equity ratio score it not favorable for JNJ, it has very limited outstanding debt, so we won't put too much weight on the DE evaluation.
- The current and quick ratio evaluation for JNJ is rather negative, while it does have excellent solvency and profitability. These ratios do not necessarly indicate liquidity issues and need to be evaluated against the specifics of the business.
Understanding NYSE:JNJ's Profitability
ChartMill assigns a Profitability Rating to every stock. This score ranges from 0 to 10 and evaluates the different profitability ratios and margins, both absolutely, but also relative to the industry peers. NYSE:JNJ scores a 8 out of 10:
- JNJ has a Return On Assets of 20.99%. This is amongst the best in the industry. JNJ outperforms 97.94% of its industry peers.
- The Return On Equity of JNJ (53.14%) is better than 97.42% of its industry peers.
- The Return On Invested Capital of JNJ (15.89%) is better than 92.78% of its industry peers.
- The last Return On Invested Capital (15.89%) for JNJ is above the 3 year average (14.68%), which is a sign of increasing profitability.
- The Profit Margin of JNJ (43.91%) is better than 97.42% of its industry peers.
- JNJ's Profit Margin has improved in the last couple of years.
- JNJ has a Operating Margin of 28.78%. This is amongst the best in the industry. JNJ outperforms 94.33% of its industry peers.
- JNJ's Operating Margin has improved in the last couple of years.
- JNJ's Gross Margin of 69.43% is fine compared to the rest of the industry. JNJ outperforms 73.20% of its industry peers.
Every day, new Best Dividend stocks can be found on ChartMill in our Best Dividend screener.
Our latest full fundamental report of JNJ contains the most current fundamental analsysis.
Keep in mind
This article should in no way be interpreted as advice. The article is based on the observed metrics at the time of writing, but you should always make your own analysis and trade or invest at your own responsibility.