
Our stock screening tool has identified JOHNSON & JOHNSON (NYSE:JNJ) as a strong dividend contender with robust fundamentals. NYSE:JNJ exhibits commendable financial health and profitability, all while offering a sustainable dividend. Let's delve into each aspect below.
Dividend Assessment of NYSE:JNJ
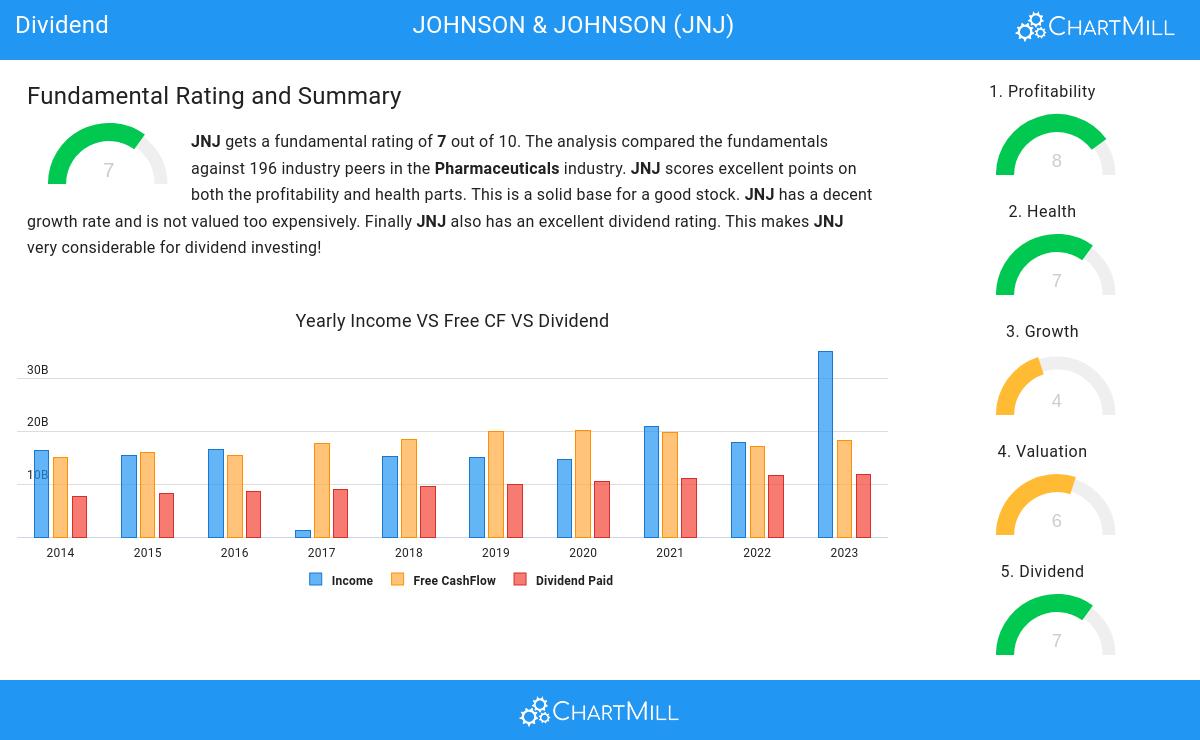
ChartMill employs its own Dividend Rating system for all stocks. This score, on a scale of 0 to 10, is determined by evaluating different dividend factors, such as yield, historical performance, dividend growth, and sustainability. NYSE:JNJ has been assigned a 7 for dividend:
- Compared to an average industry Dividend Yield of 3.85, JNJ pays a better dividend. On top of this JNJ pays more dividend than 93.85% of the companies listed in the same industry.
- JNJ's Dividend Yield is a higher than the S&P500 average which is at 2.24.
- On average, the dividend of JNJ grows each year by 9.96%, which is quite nice.
- JNJ has been paying a dividend for at least 10 years, so it has a reliable track record.
- JNJ has not decreased their dividend for at least 10 years, which is a reliable track record.
- 30.49% of the earnings are spent on dividend by JNJ. This is a low number and sustainable payout ratio.
Analyzing Health Metrics
A critical element of ChartMill's stock evaluation is the Health Rating, which spans from 0 to 10. This rating considers multiple health factors, including liquidity and solvency, both in absolute terms and relative to industry peers. NYSE:JNJ has received a 7 out of 10:
- An Altman-Z score of 4.35 indicates that JNJ is not in any danger for bankruptcy at the moment.
- With a decent Altman-Z score value of 4.35, JNJ is doing good in the industry, outperforming 77.95% of the companies in the same industry.
- The Debt to FCF ratio of JNJ is 2.04, which is a good value as it means it would take JNJ, 2.04 years of fcf income to pay off all of its debts.
- JNJ has a Debt to FCF ratio of 2.04. This is amongst the best in the industry. JNJ outperforms 94.36% of its industry peers.
- Even though the debt/equity ratio score it not favorable for JNJ, it has very limited outstanding debt, so we won't put too much weight on the DE evaluation.
- JNJ does not score too well on the current and quick ratio evaluation. However, as it has excellent solvency and profitability, these ratios do not necessarly indicate liquidity issues and need to be evaluated against the specifics of the business.
Evaluating Profitability: NYSE:JNJ
Discover ChartMill's exclusive Profitability Rating, a proprietary metric that assesses stocks on a scale of 0 to 10. It takes into consideration various profitability ratios and margins, both in absolute terms and relative to industry peers. Notably, NYSE:JNJ has achieved a 8:
- With an excellent Return On Assets value of 20.99%, JNJ belongs to the best of the industry, outperforming 97.95% of the companies in the same industry.
- Looking at the Return On Equity, with a value of 53.14%, JNJ belongs to the top of the industry, outperforming 97.44% of the companies in the same industry.
- JNJ has a better Return On Invested Capital (15.89%) than 92.82% of its industry peers.
- The 3 year average ROIC (14.68%) for JNJ is below the current ROIC(15.89%), indicating increased profibility in the last year.
- The Profit Margin of JNJ (43.91%) is better than 97.44% of its industry peers.
- JNJ's Profit Margin has improved in the last couple of years.
- The Operating Margin of JNJ (28.78%) is better than 94.36% of its industry peers.
- JNJ's Operating Margin has improved in the last couple of years.
- JNJ's Gross Margin of 69.43% is fine compared to the rest of the industry. JNJ outperforms 72.82% of its industry peers.
Every day, new Best Dividend stocks can be found on ChartMill in our Best Dividend screener.
Check the latest full fundamental report of JNJ for a complete fundamental analysis.
Disclaimer
This article should in no way be interpreted as advice. The article is based on the observed metrics at the time of writing, but you should always make your own analysis and trade or invest at your own responsibility.