
Why NYSE:JHG qualifies as a high growth stock.
By Mill Chart
Last update: Feb 14, 2025
JANUS HENDERSON GROUP PLC (NYSE:JHG) was identified as a Technical Breakout Setup Pattern by our stockscreener. Such a pattern occurs when we see a pause in a strong uptrend: after a strong rise the stock is consolidating a bit and at some point the trend may be continued. Whether this actually happens can not be predicted of course, but it may be a good idea to keep and eye on NYSE:JHG.
Technical Analysis Observations
Every day, ChartMill assigns a Technical Rating to each stock, providing a score ranging from 0 to 10. This rating is determined by evaluating various technical indicators and properties.
Taking everything into account, JHG scores 8 out of 10 in our technical rating. This is due to a consistent overall performance, although we see some doubts in the very recent evolution. In the medium time frame things are still looking good.
- The long term trend is positive and the short term trend is neutral. The long term trend gets the benefit of the doubt for now.
- When comparing the yearly performance of all stocks, we notice that JHG is one of the better performing stocks in the market, outperforming 83% of all stocks. We also observe that the gains produced by JHG over the past year are nicely spread over this period.
- JHG is one of the better performing stocks in the Capital Markets industry, it outperforms 84% of 224 stocks in the same industry.
- JHG is currently trading in the upper part of its 52 week range. The S&P500 Index however is currently trading near a new high, so JHG is lagging the market slightly.
- In the last month JHG has a been trading in the 41.62 - 46.68 range, which is quite wide. It is currently trading in the middle of this range, so some resistance may be found above.
For an up to date full technical analysis you can check the technical report of JHG
How do we evaluate the setup for NYSE:JHG?
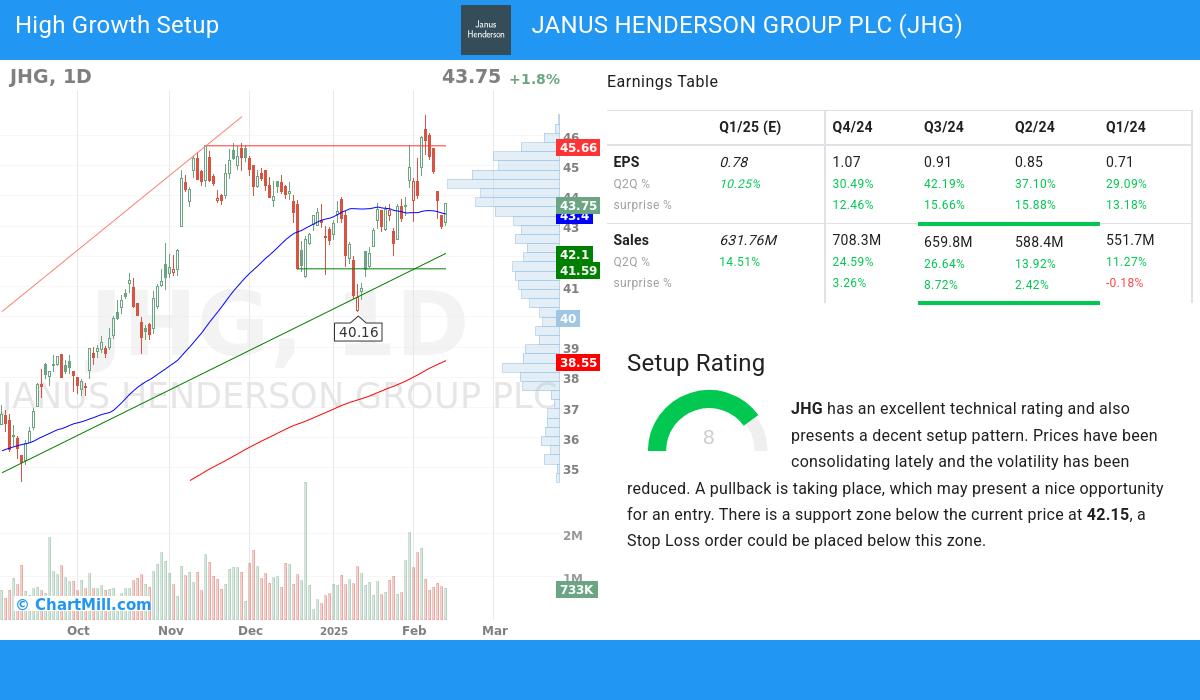
Next to the Technical Rating, the Setup Rating of a stock determines to which extend the stock is consolidating. This score also ranges from 0 to 10 and is updated daily. The setup score evaluates various short term technical indicators. For NYSE:JHG this score is currently 8:
Besides having an excellent technical rating, JHG also presents a decent setup pattern. Prices have been consolidating lately and the volatility has been reduced. A pullback is taking place, which may present a nice opportunity for an entry. There is a support zone below the current price at 42.15, a Stop Loss order could be placed below this zone.
Some of the high growth metrics of NYSE:JHG highlighted
- In the most recent financial report, JANUS HENDERSON GROUP PLC reported a 30.49% increase in quarterly earnings compared to the previous quarter. This notable growth indicates positive momentum in the company's financials, suggesting an upward trend
- The q2q revenue growth of 24.59% of JANUS HENDERSON GROUP PLC highlights the company's ability to generate incremental revenue and suggests positive market demand for its products or services.
- With notable 1-year revenue growth of 42.34%, JANUS HENDERSON GROUP PLC exemplifies its ability to generate increased sales and revenue streams. This growth signifies the company's strong business performance and its potential for future growth.
- In the most recent financial report, JANUS HENDERSON GROUP PLC reported a 30.49% increase in quarterly earnings compared to the previous quarter. This notable growth indicates positive momentum in the company's financials, suggesting an upward trend
- With positive growth in its operating margin over the past year, JANUS HENDERSON GROUP PLC showcases its ability to improve profitability through effective cost control and operational efficiency. This growth underscores the company's commitment to enhancing its financial performance.
- The free cash flow (FCF) of JANUS HENDERSON GROUP PLC has seen steady growth over the past year, indicating enhanced cash flow generation and financial health. This trend underscores the company's effective capital management and its ability to generate sustainable cash flows.
- The Return on Equity (ROE) of JANUS HENDERSON GROUP PLC stands at 11.35%, reflecting the company's strong profitability and effective utilization of shareholder equity. This metric signifies the company's ability to generate returns for its investors.
- With a current Debt-to-Equity ratio at 0.09, JANUS HENDERSON GROUP PLC showcases its disciplined capital structure. The company's prudent management of debt obligations contributes to its financial stability and long-term sustainability.
- JANUS HENDERSON GROUP PLC has consistently surpassed EPS estimates in the last 4 quarters, reflecting its strong financial performance and effective management. This trend suggests the company's ability to generate positive earnings surprises and drive shareholder value.
- The Relative Strength (RS) of JANUS HENDERSON GROUP PLC has been consistently solid, with a current 83.63 rating. This highlights the stock's ability to exhibit sustained price strength and signifies its competitive advantage. JANUS HENDERSON GROUP PLC exhibits strong prospects for further price appreciation.
More high growth momentum breakout stocks can be found in our High Growth Momentum Breakout screen.
Keep in mind
This article should in no way be interpreted as advice. The article is based on the observed metrics at the time of writing, but you should always make your own analysis and trade or invest at your own responsibility.
