Exploring JANUS INTERNATIONAL GROUP IN (NYSE:JBI)s quality characteristics.
By Mill Chart
Last update: Mar 24, 2025
Quality investors are looking for the best of the best. Companies which are growing steadily and consistently, but are also in excellent financial condition. We will have a look here to see if JANUS INTERNATIONAL GROUP IN (NYSE:JBI) is suited for quality investing. Investors should of course do their own research, but we spotted JANUS INTERNATIONAL GROUP IN showing up in our Caviar Cruise quality screen, so it may be worth spending some more time on it.
A Deep Dive into JANUS INTERNATIONAL GROUP IN's Quality Metrics.
- Over the past 5 years, JBI has experienced impressive revenue growth, with 11.26% increase. This demonstrates the company's ability to effectively expand its top line and suggests a positive outlook for future revenue generation.
- With a notable ROIC excluding cash and goodwill at 44.29%, JBI demonstrates its commitment to generating sustainable returns for shareholders. This metric emphasizes the company's effective use of capital and its ability to deliver long-term value.
- With a Debt/Free Cash Flow Ratio of 4.42, JBI exhibits solid financial health and responsible debt management practices. This ratio indicates the company's ability to generate ample free cash flow to meet its debt obligations and pursue growth opportunities.
- With a favorable Profit Quality (5-year) ratio of 140.0%, JBI showcases its ability to consistently deliver high-quality profits. This metric signifies the company's financial strength and its capacity to generate sustainable earnings over an extended period.
- The 5-year EBIT growth of JBI has been remarkable, with 12.84% increase. This demonstrates the company's ability to improve its operational efficiency and indicates its competitiveness within the market.
- JBI has achieved impressive EBIT 5-year growth, surpassing its Revenue 5-year growth. This indicates the company's ability to improve its profitability and operational efficiency, highlighting its strong financial performance.
How does the complete fundamental picture look for JBI?
ChartMill utilizes a proprietary algorithm to assign a Fundamental Rating to every stock. This rating, ranging from 0 to 10, is computed daily by analyzing a variety of fundamental indicators and properties.
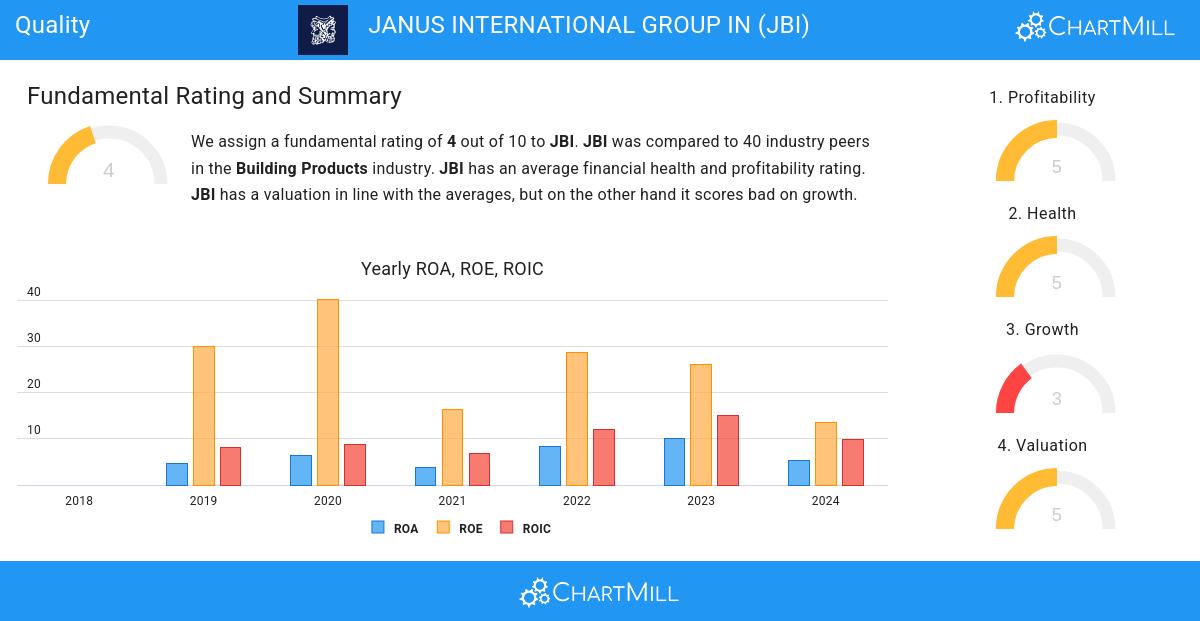
We assign a fundamental rating of 4 out of 10 to JBI. JBI was compared to 40 industry peers in the Building Products industry. JBI has only an average score on both its financial health and profitability. JBI is valued correctly, but it does not seem to be growing.
Check the latest full fundamental report of JBI for a complete fundamental analysis.
More quality stocks can be found in our Caviar Cruise screen.
Disclaimer
This is not investing advice! The article highlights some of the observations at the time of writing, but you should always make your own analysis and invest based on your own insights.
6.41
+0.35 (+5.78%)
Find more stocks in the Stock Screener
JBI Latest News and Analysis
 3 days ago - ChartmillReasonable growth and debt and a high ROIC for JANUS INTERNATIONAL GROUP IN (NYSE:JBI).
A fundamental analysis of (NYSE:JBI): Analyzing the Quality Characteristics of JANUS INTERNATIONAL GROUP IN (NYSE:JBI).
