
For growth-minded investors, high revenue and EPS growth are key criteria. Today, we'll examine whether INGERSOLL-RAND INC (NYSE:IR) fits the bill for growth investing, particularly as it forms a base and hints at a potential breakout. Remember, due diligence is essential, but INGERSOLL-RAND INC has caught our attention on our screen for growth with base formation. It may warrant additional investigation.
Growth Examination for NYSE:IR
ChartMill assigns a Growth Rating to every stock. This score ranges from 0 to 10 and evaluates the different growth aspects like EPS and Revenue, both in the past as in the future. NYSE:IR scores a 8 out of 10:
- IR shows a strong growth in Earnings Per Share. In the last year, the EPS has been growing by 21.35%, which is quite impressive.
- The Earnings Per Share has been growing by 9.50% on average over the past years. This is quite good.
- Looking at the last year, IR shows a quite strong growth in Revenue. The Revenue has grown by 8.99% in the last year.
- The Revenue has been growing by 20.65% on average over the past years. This is a very strong growth!
- Based on estimates for the next years, IR will show a quite strong growth in Earnings Per Share. The EPS will grow by 12.77% on average per year.
- The Revenue is expected to grow by 8.51% on average over the next years. This is quite good.
- The EPS growth rate is accelerating: in the next years the growth will be better than in the last years.
Unpacking NYSE:IR's Health Rating
ChartMill assigns a proprietary Health Rating to each stock. The score is computed by evaluating various liquidity and solvency ratios and ranges from 0 to 10. NYSE:IR was assigned a score of 6 for health:
- An Altman-Z score of 4.02 indicates that IR is not in any danger for bankruptcy at the moment.
- With a decent Altman-Z score value of 4.02, IR is doing good in the industry, outperforming 66.67% of the companies in the same industry.
- IR has a debt to FCF ratio of 3.65. This is a good value and a sign of high solvency as IR would need 3.65 years to pay back of all of its debts.
- With a decent Debt to FCF ratio value of 3.65, IR is doing good in the industry, outperforming 62.79% of the companies in the same industry.
- A Debt/Equity ratio of 0.48 indicates that IR is not too dependend on debt financing.
- A Current Ratio of 2.18 indicates that IR has no problem at all paying its short term obligations.
- The Quick ratio of IR (1.52) is better than 70.54% of its industry peers.
Analyzing Profitability Metrics
Discover ChartMill's exclusive Profitability Rating, a proprietary metric that assesses stocks on a scale of 0 to 10. It takes into consideration various profitability ratios and margins, both in absolute terms and relative to industry peers. Notably, NYSE:IR has achieved a 7:
- The 3 year average ROIC (5.30%) for IR is below the current ROIC(6.68%), indicating increased profibility in the last year.
- With a decent Profit Margin value of 11.73%, IR is doing good in the industry, outperforming 79.84% of the companies in the same industry.
- In the last couple of years the Profit Margin of IR has grown nicely.
- IR's Operating Margin of 19.48% is amongst the best of the industry. IR outperforms 86.05% of its industry peers.
- IR has a better Gross Margin (43.49%) than 82.95% of its industry peers.
- In the last couple of years the Gross Margin of IR has grown nicely.
Why is NYSE:IR a setup?
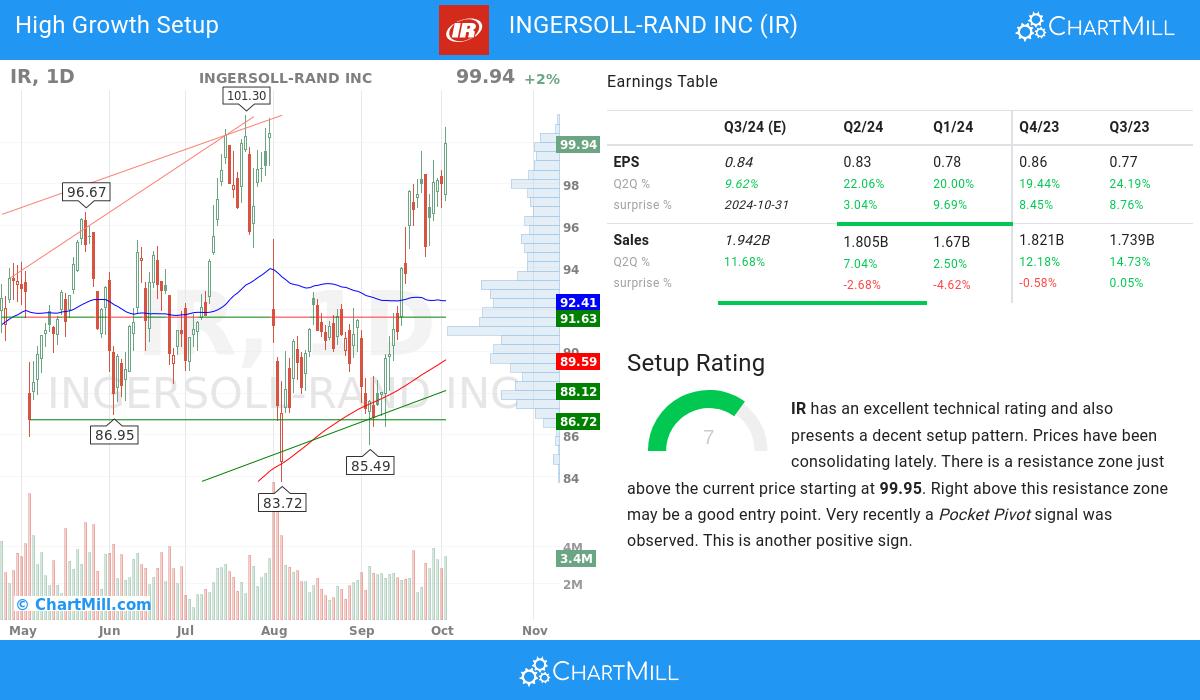
ChartMill also assign a Setup Rating to every stock. With this score it is determined to what extend the stock has been trading in a range in the recent days and weeks. This score also ranges from 0 to 10 and is updated daily. The setup score evaluates various short term technical indicators. NYSE:IR scores a 7 out of 10:
Besides having an excellent technical rating, IR also presents a decent setup pattern. Prices have been consolidating lately. There is a resistance zone just above the current price starting at 99.95. Right above this resistance zone may be a good entry point. Another positive sign is the recent Pocket Pivot signal.
Our Strong Growth screener lists more Strong Growth stocks and is updated daily.
For an up to date full fundamental analysis you can check the fundamental report of IR
Our latest full technical report of IR contains the most current technical analsysis.
Keep in mind
Important Note: The content of this article is not intended as trading advice. It is essential to perform your own analysis and exercise caution when making trading decisions. The article presents observations created by automated analysis but does not guarantee any trading or investment outcomes. Always trade responsibly and make independent judgments.