NYSE:INSW is a prime example of a stock that offers more than what meets the eye in terms of fundamentals.
By Mill Chart
Last update: Oct 21, 2024
Discover INTERNATIONAL SEAWAYS INC (NYSE:INSW)—an undervalued stock our stock screener has picked out. NYSE:INSW demonstrates solid fundamentals, including health and profitability, all while staying attractively priced. Let's explore the details.
ChartMill's Evaluation of Valuation
ChartMill employs its own Valuation Rating system for all stocks. This score, ranging from 0 to 10, is determined by evaluating different valuation factors, including price to earnings and free cash flow, both in absolute terms and relative to the market and industry. NYSE:INSW has earned a 8 for valuation:
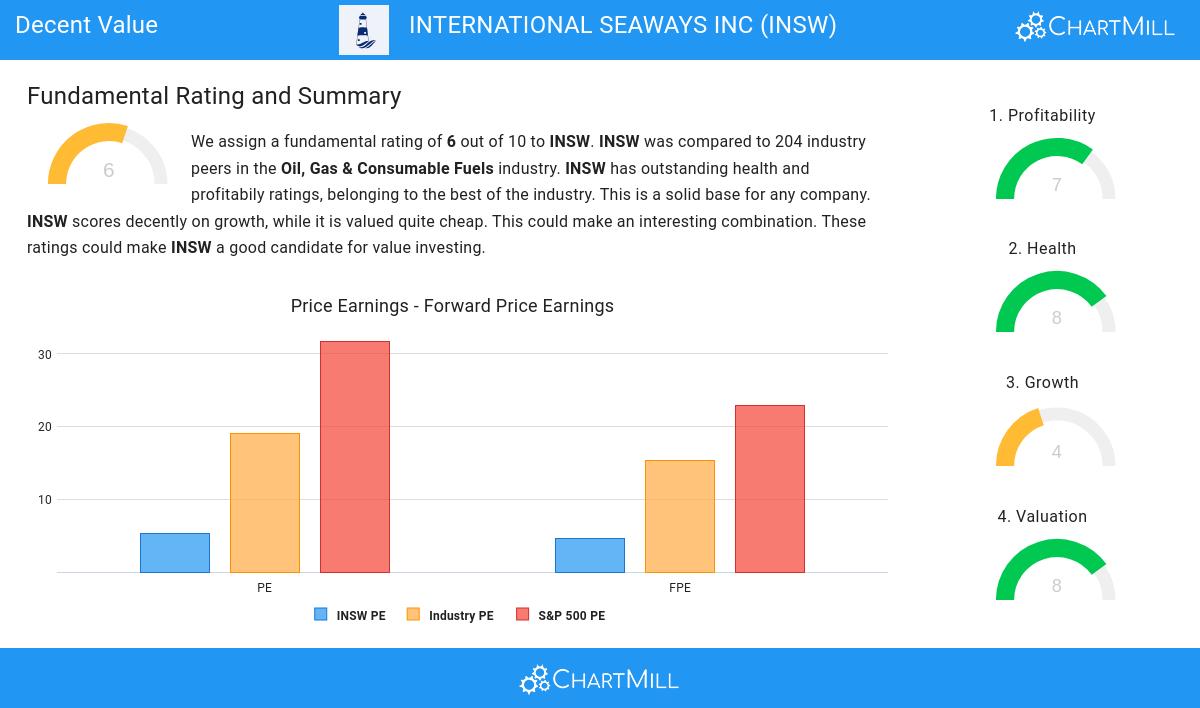
- A Price/Earnings ratio of 5.26 indicates a rather cheap valuation of INSW.
- Based on the Price/Earnings ratio, INSW is valued cheaper than 88.73% of the companies in the same industry.
- When comparing the Price/Earnings ratio of INSW to the average of the S&P500 Index (31.71), we can say INSW is valued rather cheaply.
- A Price/Forward Earnings ratio of 4.59 indicates a rather cheap valuation of INSW.
- INSW's Price/Forward Earnings ratio is rather cheap when compared to the industry. INSW is cheaper than 91.18% of the companies in the same industry.
- INSW is valuated cheaply when we compare the Price/Forward Earnings ratio to 22.81, which is the current average of the S&P500 Index.
- Based on the Enterprise Value to EBITDA ratio, INSW is valued a bit cheaper than the industry average as 67.65% of the companies are valued more expensively.
- Compared to the rest of the industry, the Price/Free Cash Flow ratio of INSW indicates a rather cheap valuation: INSW is cheaper than 81.37% of the companies listed in the same industry.
- INSW has a very decent profitability rating, which may justify a higher PE ratio.
Profitability Insights: NYSE:INSW
ChartMill assigns a proprietary Profitability Rating to each stock. The score is computed by evaluating various profitability ratios and margins and ranges from 0 to 10. NYSE:INSW was assigned a score of 7 for profitability:
- The Return On Assets of INSW (19.40%) is better than 89.71% of its industry peers.
- INSW's Return On Equity of 27.50% is amongst the best of the industry. INSW outperforms 83.33% of its industry peers.
- The Return On Invested Capital of INSW (15.96%) is better than 84.80% of its industry peers.
- Looking at the Profit Margin, with a value of 50.67%, INSW belongs to the top of the industry, outperforming 89.71% of the companies in the same industry.
- INSW's Operating Margin of 50.56% is amongst the best of the industry. INSW outperforms 87.25% of its industry peers.
- In the last couple of years the Operating Margin of INSW has grown nicely.
- With a decent Gross Margin value of 69.85%, INSW is doing good in the industry, outperforming 76.47% of the companies in the same industry.
- In the last couple of years the Gross Margin of INSW has grown nicely.
Understanding NYSE:INSW's Health Score
ChartMill assigns a Health Rating to every stock. This score ranges from 0 to 10 and evaluates the different health aspects like liquidity and solvency, both absolutely, but also relative to the industry peers. NYSE:INSW scores a 8 out of 10:
- An Altman-Z score of 3.23 indicates that INSW is not in any danger for bankruptcy at the moment.
- With a decent Altman-Z score value of 3.23, INSW is doing good in the industry, outperforming 77.94% of the companies in the same industry.
- INSW has a debt to FCF ratio of 1.89. This is a very positive value and a sign of high solvency as it would only need 1.89 years to pay back of all of its debts.
- INSW's Debt to FCF ratio of 1.89 is fine compared to the rest of the industry. INSW outperforms 77.45% of its industry peers.
- INSW has a Debt/Equity ratio of 0.35. This is a healthy value indicating a solid balance between debt and equity.
- A Current Ratio of 3.89 indicates that INSW has no problem at all paying its short term obligations.
- Looking at the Current ratio, with a value of 3.89, INSW belongs to the top of the industry, outperforming 84.80% of the companies in the same industry.
- INSW has a Quick Ratio of 3.87. This indicates that INSW is financially healthy and has no problem in meeting its short term obligations.
- INSW's Quick ratio of 3.87 is amongst the best of the industry. INSW outperforms 85.29% of its industry peers.
Unpacking NYSE:INSW's Growth Rating
Every stock receives a Growth Rating from ChartMill, ranging from 0 to 10. This rating assesses various growth aspects, including historical and projected EPS and revenue growth. NYSE:INSW boasts a 4 out of 10:
- INSW shows a strong growth in Earnings Per Share. Measured over the last years, the EPS has been growing by 34.71% yearly.
- The Revenue has been growing by 31.71% on average over the past years. This is a very strong growth!
More Decent Value stocks can be found in our Decent Value screener.
For an up to date full fundamental analysis you can check the fundamental report of INSW
Keep in mind
This article should in no way be interpreted as advice. The article is based on the observed metrics at the time of writing, but you should always make your own analysis and trade or invest at your own responsibility.
33.64
-0.73 (-2.12%)
Find more stocks in the Stock Screener
INSW Latest News and Analysis
 13 hours ago - ChartmillINTERNATIONAL SEAWAYS INC (NYSE:INSW): good value for what you're paying.
INTERNATIONAL SEAWAYS INC has a stellar value proposition. NYSE:INSW not only scores well in profitability, solvency, and liquidity but also maintains a very reasonable price point.
