
NYSE:INSW appears to be flying under the radar despite its strong fundamentals.
By Mill Chart
Last update: Sep 6, 2024
Our stock screening tool has pinpointed INTERNATIONAL SEAWAYS INC (NYSE:INSW) as an undervalued stock. NYSE:INSW maintains a solid financial footing. Furthermore, it remains attractively priced. Let's delve into the specifics below.
Analyzing Valuation Metrics
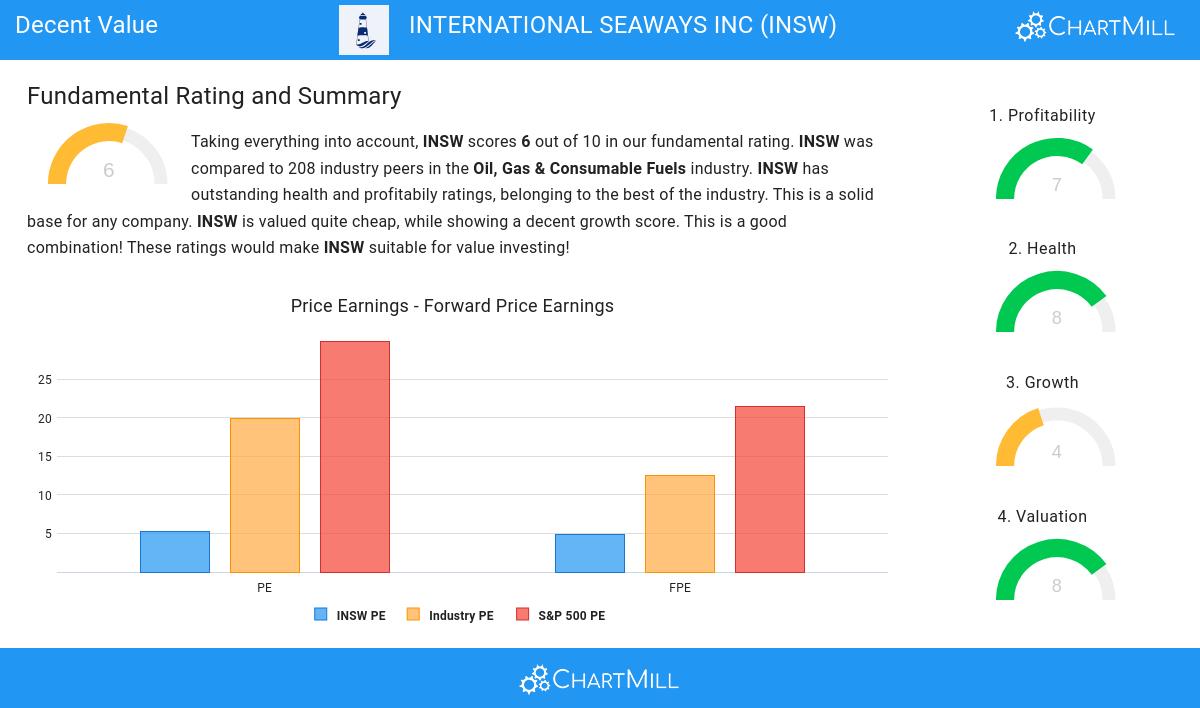
ChartMill assigns a Valuation Rating to every stock. This score ranges from 0 to 10 and evaluates the different valuation aspects and compares the price to earnings and cash flows, while taking into account profitability and growth. NYSE:INSW scores a 8 out of 10:
- INSW is valuated cheaply with a Price/Earnings ratio of 5.22.
- Compared to the rest of the industry, the Price/Earnings ratio of INSW indicates a rather cheap valuation: INSW is cheaper than 88.94% of the companies listed in the same industry.
- When comparing the Price/Earnings ratio of INSW to the average of the S&P500 Index (29.93), we can say INSW is valued rather cheaply.
- The Price/Forward Earnings ratio is 4.87, which indicates a rather cheap valuation of INSW.
- Based on the Price/Forward Earnings ratio, INSW is valued cheaply inside the industry as 88.94% of the companies are valued more expensively.
- Compared to an average S&P500 Price/Forward Earnings ratio of 21.45, INSW is valued rather cheaply.
- Based on the Enterprise Value to EBITDA ratio, INSW is valued a bit cheaper than the industry average as 68.75% of the companies are valued more expensively.
- 81.73% of the companies in the same industry are more expensive than INSW, based on the Price/Free Cash Flow ratio.
- INSW has a very decent profitability rating, which may justify a higher PE ratio.
Profitability Analysis for NYSE:INSW
Discover ChartMill's exclusive Profitability Rating, a proprietary metric that assesses stocks on a scale of 0 to 10. It takes into consideration various profitability ratios and margins, both in absolute terms and relative to industry peers. Notably, NYSE:INSW has achieved a 7:
- INSW's Return On Assets of 19.40% is amongst the best of the industry. INSW outperforms 90.38% of its industry peers.
- With an excellent Return On Equity value of 27.50%, INSW belongs to the best of the industry, outperforming 83.65% of the companies in the same industry.
- INSW has a Return On Invested Capital of 15.96%. This is amongst the best in the industry. INSW outperforms 85.10% of its industry peers.
- With an excellent Profit Margin value of 50.67%, INSW belongs to the best of the industry, outperforming 90.38% of the companies in the same industry.
- With an excellent Operating Margin value of 50.56%, INSW belongs to the best of the industry, outperforming 87.50% of the companies in the same industry.
- In the last couple of years the Operating Margin of INSW has grown nicely.
- INSW has a Gross Margin of 69.85%. This is in the better half of the industry: INSW outperforms 76.92% of its industry peers.
- INSW's Gross Margin has improved in the last couple of years.
A Closer Look at Health for NYSE:INSW
ChartMill employs a unique Health Rating system for all stocks. This rating, ranging from 0 to 10, is determined by analyzing various liquidity and solvency ratios. For NYSE:INSW, the assigned 8 for health provides valuable insights:
- INSW has an Altman-Z score of 3.21. This indicates that INSW is financially healthy and has little risk of bankruptcy at the moment.
- INSW has a Altman-Z score of 3.21. This is in the better half of the industry: INSW outperforms 78.85% of its industry peers.
- INSW has a debt to FCF ratio of 1.89. This is a very positive value and a sign of high solvency as it would only need 1.89 years to pay back of all of its debts.
- With a decent Debt to FCF ratio value of 1.89, INSW is doing good in the industry, outperforming 77.88% of the companies in the same industry.
- A Debt/Equity ratio of 0.35 indicates that INSW is not too dependend on debt financing.
- INSW has a Current Ratio of 3.89. This indicates that INSW is financially healthy and has no problem in meeting its short term obligations.
- INSW has a better Current ratio (3.89) than 85.58% of its industry peers.
- A Quick Ratio of 3.87 indicates that INSW has no problem at all paying its short term obligations.
- With an excellent Quick ratio value of 3.87, INSW belongs to the best of the industry, outperforming 86.06% of the companies in the same industry.
A Closer Look at Growth for NYSE:INSW
Every stock receives a Growth Rating from ChartMill, ranging from 0 to 10. This rating assesses various growth aspects, including historical and projected EPS and revenue growth. NYSE:INSW boasts a 4 out of 10:
- The Earnings Per Share has been growing by 34.71% on average over the past years. This is a very strong growth
- The Revenue has been growing by 31.71% on average over the past years. This is a very strong growth!
Every day, new Decent Value stocks can be found on ChartMill in our Decent Value screener.
For an up to date full fundamental analysis you can check the fundamental report of INSW
Keep in mind
Important Note: The content of this article is not intended as trading advice. It is essential to perform your own analysis and exercise caution when making trading decisions. The article presents observations created by automated analysis but does not guarantee any trading or investment outcomes. Always trade responsibly and make independent judgments.
NYSE:INSW (4/25/2025, 12:08:15 PM)
33.85
+0.62 (+1.87%)
Find more stocks in the Stock Screener
