Don't overlook INCYTE CORP (NASDAQ:INCY)—it's a hidden gem with strong fundamentals and an attractive price tag.
By Mill Chart
Last update: Mar 17, 2025
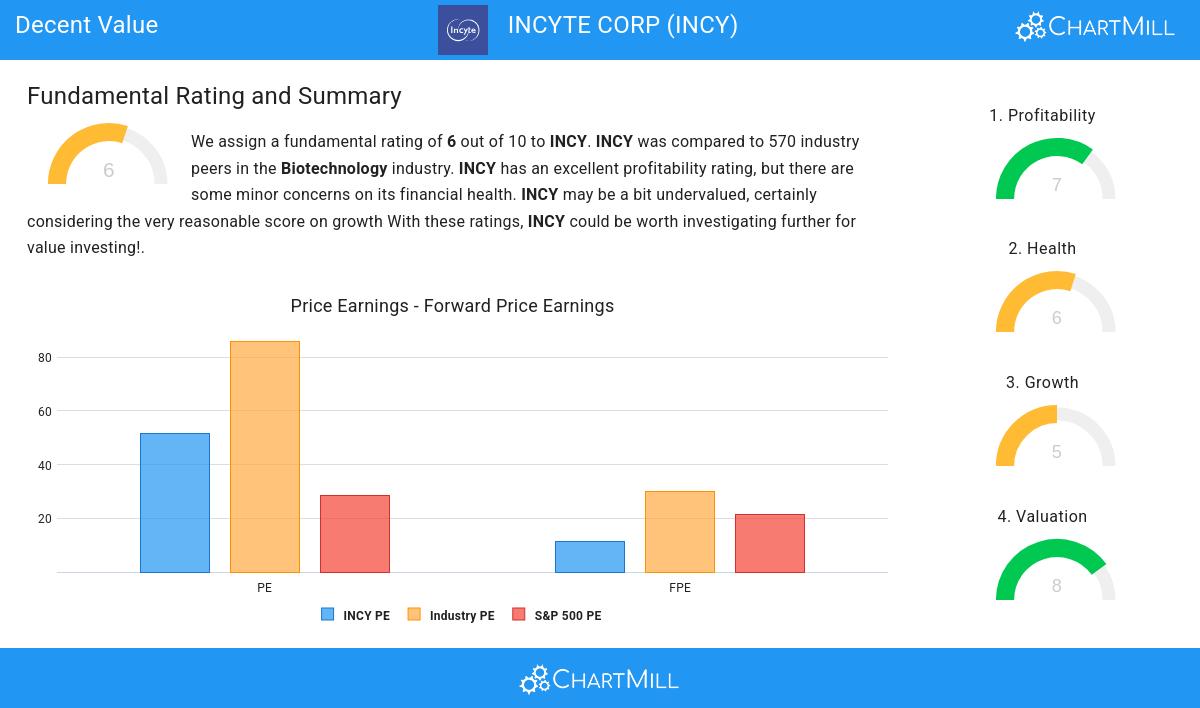
INCYTE CORP (NASDAQ:INCY) is a hidden gem identified by our stock screening tool, featuring undervaluation and robust fundamentals. INCY showcases decent financial health and profitability, coupled with an attractive price. Let's dig deeper into the analysis.
Deciphering INCY's Valuation Rating
An integral part of ChartMill's stock analysis is the Valuation Rating, which spans from 0 to 10. This rating evaluates diverse valuation factors, including price to earnings and cash flows, while considering the stock's profitability and growth. INCY has received a 8 out of 10:
- Based on the Price/Earnings ratio, INCY is valued cheaper than 93.68% of the companies in the same industry.
- The Price/Forward Earnings ratio is 11.43, which indicates a very decent valuation of INCY.
- Compared to the rest of the industry, the Price/Forward Earnings ratio of INCY indicates a rather cheap valuation: INCY is cheaper than 97.02% of the companies listed in the same industry.
- The average S&P500 Price/Forward Earnings ratio is at 21.58. INCY is valued slightly cheaper when compared to this.
- INCY's Enterprise Value to EBITDA ratio is rather cheap when compared to the industry. INCY is cheaper than 93.33% of the companies in the same industry.
- Based on the Price/Free Cash Flow ratio, INCY is valued cheaply inside the industry as 93.68% of the companies are valued more expensively.
- The low PEG Ratio(NY), which compensates the Price/Earnings for growth, indicates a rather cheap valuation of the company.
- INCY has a very decent profitability rating, which may justify a higher PE ratio.
- INCY's earnings are expected to grow with 87.42% in the coming years. This may justify a more expensive valuation.
Understanding INCY's Profitability
ChartMill's Profitability Rating offers a unique perspective on stock analysis, providing scores from 0 to 10. These ratings consider a wide range of profitability metrics and margins, both in comparison to industry peers and on their own merits. For INCY, the assigned 7 is a significant indicator of profitability:
- INCY's Return On Assets of 0.60% is amongst the best of the industry. INCY outperforms 91.75% of its industry peers.
- Looking at the Return On Equity, with a value of 0.95%, INCY belongs to the top of the industry, outperforming 92.46% of the companies in the same industry.
- INCY has a Return On Invested Capital of 2.32%. This is amongst the best in the industry. INCY outperforms 93.16% of its industry peers.
- The last Return On Invested Capital (2.32%) for INCY is well below the 3 year average (7.24%), which needs to be investigated, but indicates that INCY had better years and this may not be a problem.
- The Profit Margin of INCY (0.77%) is better than 92.28% of its industry peers.
- INCY has a Operating Margin of 2.63%. This is amongst the best in the industry. INCY outperforms 93.16% of its industry peers.
- INCY has a better Gross Margin (93.20%) than 93.86% of its industry peers.
Health Analysis for INCY
Every stock is evaluated by ChartMill, receiving a Health Rating on a scale of 0 to 10. This assessment considers different health aspects, including liquidity and solvency, both in absolute terms and relative to industry peers. INCY has achieved a 6 out of 10:
- INCY has an Altman-Z score of 4.87. This indicates that INCY is financially healthy and has little risk of bankruptcy at the moment.
- The Altman-Z score of INCY (4.87) is better than 80.00% of its industry peers.
- The Debt to FCF ratio of INCY is 0.15, which is an excellent value as it means it would take INCY, only 0.15 years of fcf income to pay off all of its debts.
- INCY has a Debt to FCF ratio of 0.15. This is amongst the best in the industry. INCY outperforms 96.84% of its industry peers.
- INCY has a Debt/Equity ratio of 0.01. This is a healthy value indicating a solid balance between debt and equity.
Growth Analysis for INCY
Every stock receives a Growth Rating from ChartMill, ranging from 0 to 10. This rating assesses various growth aspects, including historical and projected EPS and revenue growth. INCY boasts a 5 out of 10:
- Looking at the last year, INCY shows a quite strong growth in Revenue. The Revenue has grown by 14.76% in the last year.
- Measured over the past years, INCY shows a quite strong growth in Revenue. The Revenue has been growing by 14.46% on average per year.
- INCY is expected to show a strong growth in Earnings Per Share. In the coming years, the EPS will grow by 29.76% yearly.
- The EPS growth rate is accelerating: in the next years the growth will be better than in the last years.
Every day, new Decent Value stocks can be found on ChartMill in our Decent Value screener.
Check the latest full fundamental report of INCY for a complete fundamental analysis.
Disclaimer
Important Note: The content of this article is not intended as trading advice. It is essential to perform your own analysis and exercise caution when making trading decisions. The article presents observations created by automated analysis but does not guarantee any trading or investment outcomes. Always trade responsibly and make independent judgments.
58.46
-0.76 (-1.28%)
Find more stocks in the Stock Screener
INCY Latest News and Analysis
 16 hours ago - ChartmillINCYTE CORP (NASDAQ:INCY) is probably undervalued for the fundamentals it is displaying.
Take a closer look at INCYTE CORP , a remarkable value stock. NASDAQ:INCY excels in fundamentals and maintains a very reasonable valuation.
 6 days ago - ChartmillWhat's going on in today's session: S&P500 movers
Stay informed about the performance of the S&P500 index in the middle of the day on Wednesday. Uncover the top gainers and losers in today's session for valuable insights.
 6 days ago - ChartmillThese S&P500 stocks are gapping in today's session
Let's have a look at the S&P500 gap up and gap down stocks in today's session.
7 days ago - ChartmillExplore the top gainers and losers within the S&P500 index in today's session.Curious about the top performers within the S&P500 index in the middle of the day on Tuesday? Dive into the list of today's session's top gainers and losers for a comprehensive overview.
7 days ago - ChartmillWhich S&P500 stocks are gapping on Tuesday?Curious about the market action on Tuesday? Dive into the US markets to explore the gap up and gap down stocks in the S&P500 index during today's session.
