
Uncovering Noteworthy Technical Analysis Findings for INCYTE CORP (NASDAQ:INCY).
By Mill Chart
Last update: Oct 14, 2024
Our stock screener has detected a potential breakout setup on INCYTE CORP (NASDAQ:INCY). This breakout pattern is observed when a stock consolidates following a strong upward movement. It's important to note that this pattern is based on technical analysis, and the actual breakout outcome is uncertain. However, it might be worth keeping an eye on NASDAQ:INCY.
Technical analysis of NASDAQ:INCY
ChartMill assigns a Technical Rating to every stock. This score, ranging from 0 to 10, is updated daily and is determined by evaluating multiple technical indicators and properties.
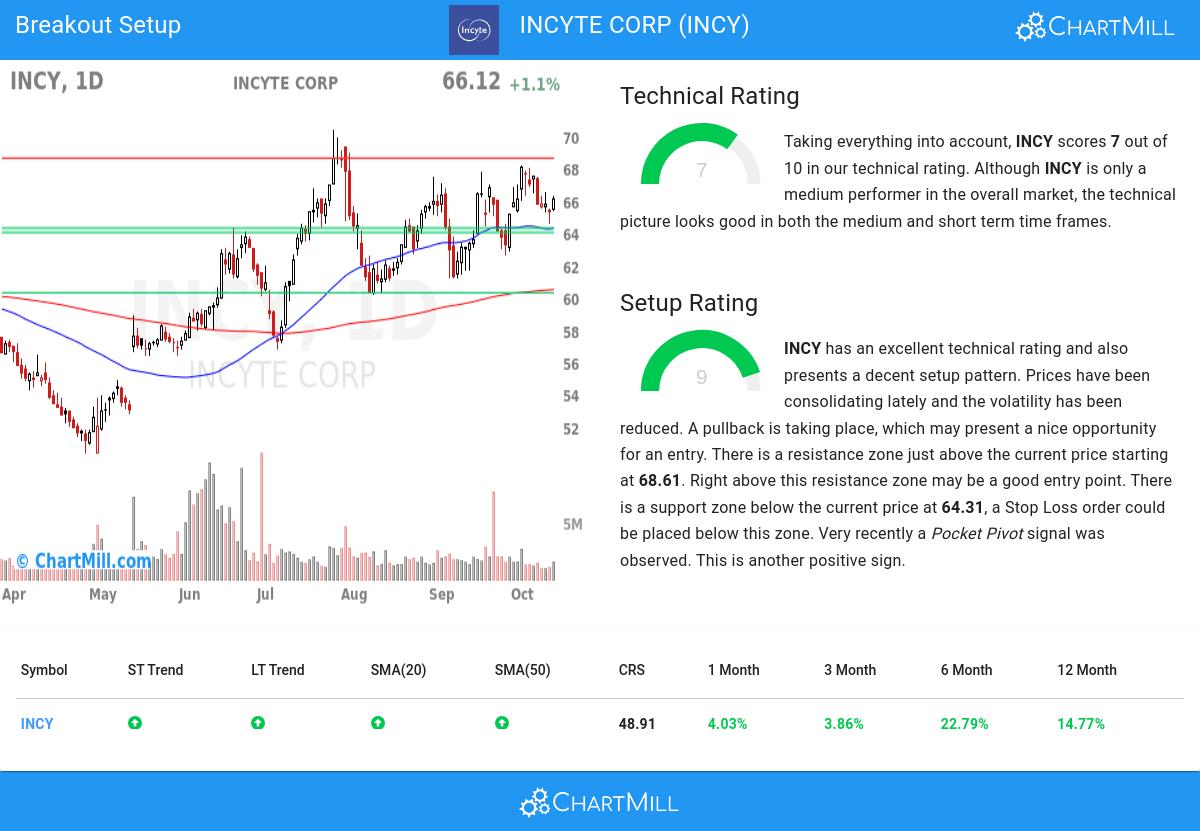
We assign a technical rating of 7 out of 10 to INCY. This is due to a decent performance in both the short and medium term time frames. Compared to the overall market, INCY is only an average performer.
- The long and short term trends are both positive. This is looking good!
- INCY is currently trading in the upper part of its 52 week range. The S&P500 Index however is currently trading near a new high, so INCY is lagging the market slightly.
- In the last month INCY has a been trading in the 62.57 - 68.17 range, which is quite wide. It is currently trading in the middle of this range where prices have been consolidating recently, this may present a good entry opportunity, but some resistance may be present above.
- When comparing the performance of all stocks over the past year, INCY turns out to be only a medium performer in the overall market: it outperformed 48% of all stocks.
- INCY is an average performer in the Biotechnology industry, it outperforms 67% of 570 stocks in the same industry.
Check the latest full technical report of INCY for a complete technical analysis.
Why is NASDAQ:INCY a setup?
ChartMill also assign a Setup Rating to every stock. With this score it is determined to what extend the stock has been trading in a range in the recent days and weeks. This score also ranges from 0 to 10 and is updated daily. The setup score evaluates various short term technical indicators. NASDAQ:INCY scores a 9 out of 10:
INCY has an excellent technical rating and also presents a decent setup pattern. Prices have been consolidating lately and the volatility has been reduced. A pullback is taking place, which may present a nice opportunity for an entry. There is a resistance zone just above the current price starting at 68.61. Right above this resistance zone may be a good entry point. There is a support zone below the current price at 64.31, a Stop Loss order could be placed below this zone. Very recently a Pocket Pivot signal was observed. This is another positive sign.
How can NASDAQ:INCY be traded?
One strategy to consider is waiting for the actual breakout to occur, where the stock breaks out above the current consolidation zone. Traders can then enter a buy position, anticipating further upward momentum. As a risk management measure, it is advisable to set a stop loss order below the consolidation zone.
Disclaimer: This article is not intended to provide trading advice. It is crucial to conduct your own analysis and consider your own observations and trading style when making investment decisions. The article solely presents technical observations and should not be relied upon as a sole basis for trading.
More breakout setups can be found in our Breakout screener.
Disclaimer
This is not investing advice! The article highlights some of the observations at the time of writing, but you should always make your own analysis and invest based on your own insights.
NASDAQ:INCY (4/17/2025, 2:50:53 PM)
58.07
+0.34 (+0.59%)
Find more stocks in the Stock Screener
INCY Latest News and Analysis
 2 days ago - ChartmillINCYTE CORP (NASDAQ:INCY) is probably undervalued for the fundamentals it is displaying.
Take a closer look at INCYTE CORP , a remarkable value stock. NASDAQ:INCY excels in fundamentals and maintains a very reasonable valuation.
 8 days ago - ChartmillWhat's going on in today's session: S&P500 movers
Stay informed about the performance of the S&P500 index in the middle of the day on Wednesday. Uncover the top gainers and losers in today's session for valuable insights.
 8 days ago - ChartmillThese S&P500 stocks are gapping in today's session
Let's have a look at the S&P500 gap up and gap down stocks in today's session.
9 days ago - ChartmillExplore the top gainers and losers within the S&P500 index in today's session.Curious about the top performers within the S&P500 index in the middle of the day on Tuesday? Dive into the list of today's session's top gainers and losers for a comprehensive overview.
9 days ago - ChartmillWhich S&P500 stocks are gapping on Tuesday?Curious about the market action on Tuesday? Dive into the US markets to explore the gap up and gap down stocks in the S&P500 index during today's session.
