
Evaluating NYSE:HWM for high Growth Investment Opportunities.
By Mill Chart
Last update: Oct 16, 2024
Our stockscreener has identified a possible breakout setup on HOWMET AEROSPACE INC (NYSE:HWM). This occurs when the stock consolidates following a significant upward movement. While the breakout outcome cannot be guaranteed, it may be worth monitoring NYSE:HWM for potential opportunities.
Deciphering the Technical Picture of NYSE:HWM
Every day ChartMill assigns a Technical Rating to every stock. The score ranges from 0 to 10 and is determined by evaluating multiple technical indicators and properties.
We assign a technical rating of 10 out of 10 to HWM. Both in the recent history as in the last year, HWM has proven to be a steady performer, scoring decent points in every aspect analyzed.
- The long and short term trends are both positive. This is looking good!
- Looking at the yearly performance, HWM did better than 96% of all other stocks. We also observe that the gains produced by HWM over the past year are nicely spread over this period.
- HWM is one of the better performing stocks in the Aerospace & Defense industry, it outperforms 90% of 67 stocks in the same industry.
- HWM is currently trading near its 52 week high, which is a good sign. The S&P500 Index however is also trading near new highs, which makes the performance in line with the market.
- In the last month HWM has a been trading in the 94.26 - 104.42 range, which is quite wide. It is currently trading near the high of this range.
Check the latest full technical report of HWM for a complete technical analysis.
Looking at the Setup
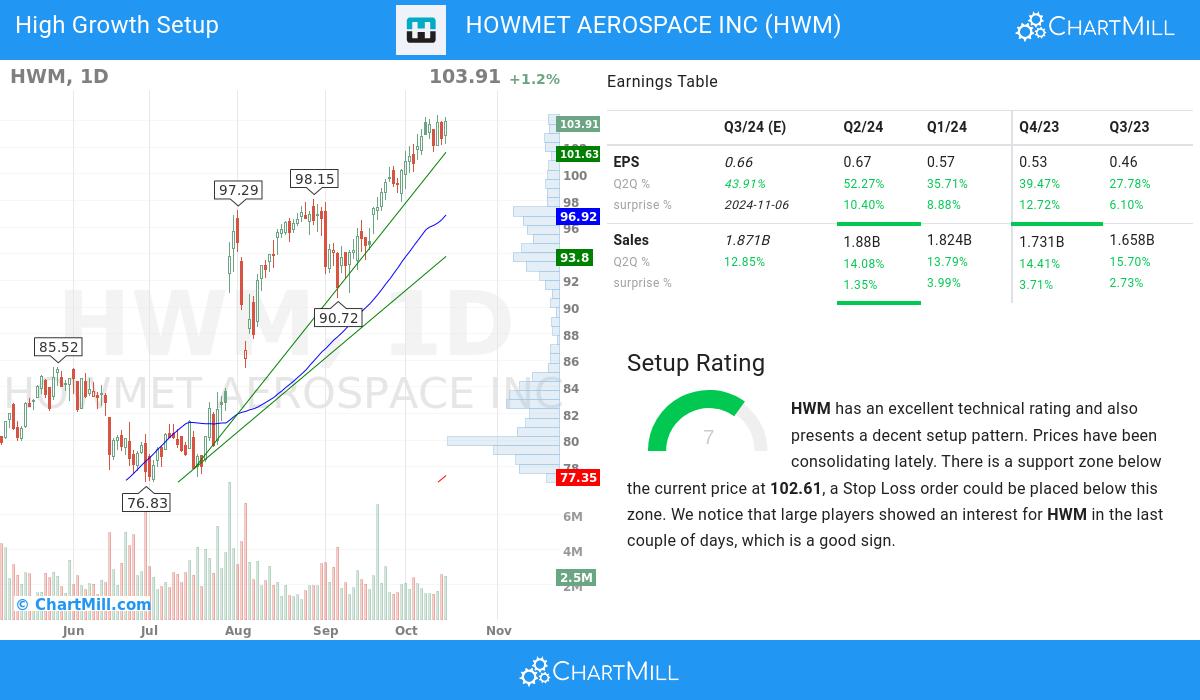
ChartMill takes into account not only the Technical Rating but also assigns a Setup Rating to each stock. This rating, on a scale of 0 to 10, reflects the degree of consolidation observed based on short-term technical indicators. Currently, NYSE:HWM exhibits a 7 setup rating, indicating its consolidation status in recent days and weeks.
HWM has an excellent technical rating and also presents a decent setup pattern. Prices have been consolidating lately. There is a support zone below the current price at 102.61, a Stop Loss order could be placed below this zone. We notice that large players showed an interest for HWM in the last couple of days, which is a good sign.
Looking into the high growth metrics of HOWMET AEROSPACE INC
- In the most recent financial report, HOWMET AEROSPACE INC reported a 52.27% increase in quarterly earnings compared to the previous quarter. This notable growth indicates positive momentum in the company's financials, suggesting an upward trend
- Over the past 3 months, analysts have adjusted their EPS Estimate for HOWMET AEROSPACE INC with a 10.21% change. This highlights the evolving outlook on the company's EPS potential.
- In the most recent financial report, HOWMET AEROSPACE INC reported a 52.27% increase in quarterly earnings compared to the previous quarter. This notable growth indicates positive momentum in the company's financials, suggesting an upward trend
- HOWMET AEROSPACE INC shows accelerating EPS growth: when comparing the current Q2Q growth of 52.27% to the previous year Q2Q growth of 25.71%, we see the growth rate improving.
- With positive growth in its operating margin over the past year, HOWMET AEROSPACE INC showcases its ability to improve profitability through effective cost control and operational efficiency. This growth underscores the company's commitment to enhancing its financial performance.
- With a favorable trend in its free cash flow (FCF) over the past year, HOWMET AEROSPACE INC demonstrates its ability to generate robust cash flows and maintain financial stability. This growth reflects the company's focus on efficient capital allocation and cash management.
- With a solid Return on Equity (ROE) of 21.77%, HOWMET AEROSPACE INC exemplifies its ability to generate favorable returns on shareholder investments. This metric demonstrates the company's commitment to maximizing shareholder value.
- Maintaining a Debt-to-Equity ratio of 0.67, HOWMET AEROSPACE INC demonstrates a conservative financial approach. This signifies the company's focus on minimizing debt burdens while preserving a solid equity position.
- HOWMET AEROSPACE INC has consistently surpassed EPS estimates in the last 4 quarters, reflecting its strong financial performance and effective management. This trend suggests the company's ability to generate positive earnings surprises and drive shareholder value.
- HOWMET AEROSPACE INC has achieved an impressive Relative Strength (RS) rating of 96.94, showcasing its ability to outperform the broader market. This strong performance positions HOWMET AEROSPACE INC as an attractive stock for potential price appreciation.
More ideas for high growth momentum breakouts can be found on ChartMill in our High Growth Momentum Breakout screen.
Keep in mind
Important Note: The content of this article is not intended as trading advice. It is essential to perform your own analysis and exercise caution when making trading decisions. The article presents observations created by automated analysis but does not guarantee any trading or investment outcomes. Always trade responsibly and make independent judgments.
198.31
+2.42 (+1.24%)
Find more stocks in the Stock Screener
HWM Latest News and Analysis


