
HUBBELL INC (NYSE:HUBB) is a hidden gem unveiled by our stock screening tool, featuring a promising dividend outlook alongside solid fundamentals. NYSE:HUBB demonstrates decent financial health and profitability while ensuring a sustainable dividend. Let's break it down further.
Dividend Analysis for NYSE:HUBB
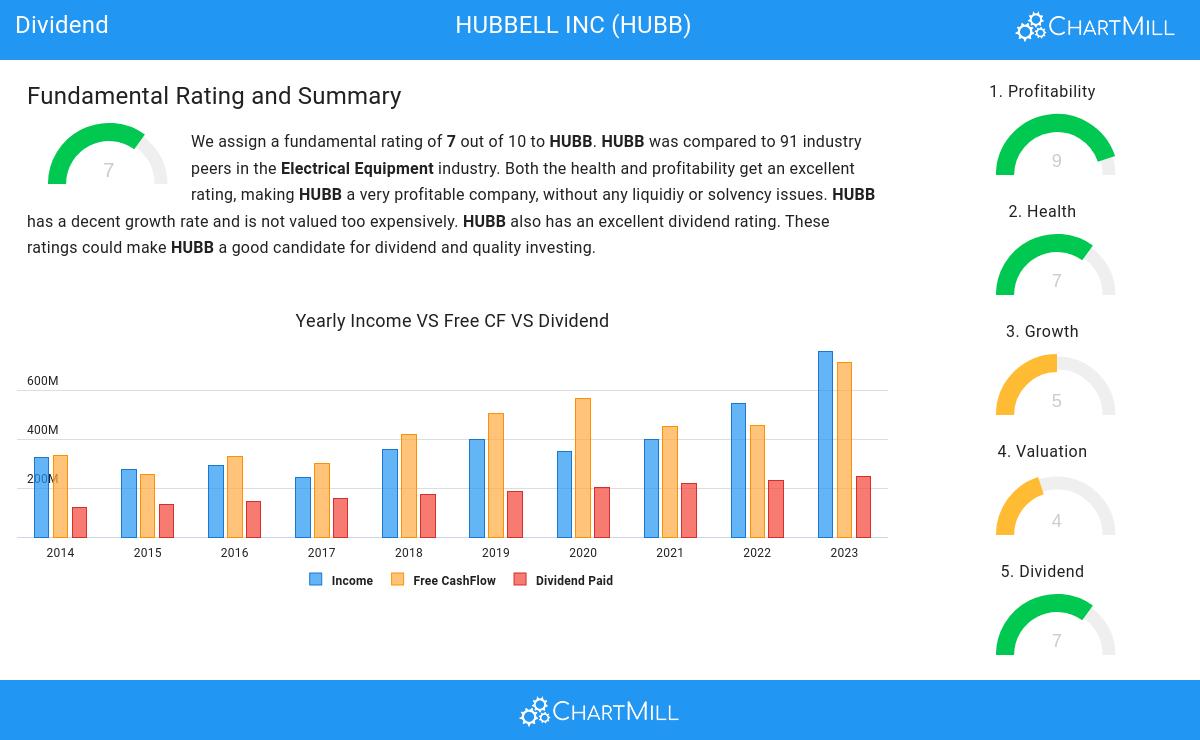
An integral part of ChartMill's stock analysis is the Dividend Rating, which spans from 0 to 10. This rating evaluates diverse dividend factors, including yield, historical data, growth, and sustainability. NYSE:HUBB has received a 7 out of 10:
- HUBB's Dividend Yield is rather good when compared to the industry average which is at 2.34. HUBB pays more dividend than 87.78% of the companies in the same industry.
- The dividend of HUBB is nicely growing with an annual growth rate of 7.77%!
- HUBB has paid a dividend for at least 10 years, which is a reliable track record.
- HUBB has not decreased its dividend for at least 10 years, so it has a reliable track record of non decreasing dividend.
- HUBB pays out 35.08% of its income as dividend. This is a sustainable payout ratio.
Exploring NYSE:HUBB's Health
ChartMill utilizes a Health Rating to assess stocks, scoring them on a scale of 0 to 10. This rating takes into account a variety of liquidity and solvency ratios, both in absolute terms and in comparison to industry peers. NYSE:HUBB has earned a 7 out of 10:
- HUBB has an Altman-Z score of 5.30. This indicates that HUBB is financially healthy and has little risk of bankruptcy at the moment.
- Looking at the Altman-Z score, with a value of 5.30, HUBB belongs to the top of the industry, outperforming 87.78% of the companies in the same industry.
- HUBB has a debt to FCF ratio of 2.86. This is a good value and a sign of high solvency as HUBB would need 2.86 years to pay back of all of its debts.
- With an excellent Debt to FCF ratio value of 2.86, HUBB belongs to the best of the industry, outperforming 81.11% of the companies in the same industry.
- The current and quick ratio evaluation for HUBB is rather negative, while it does have excellent solvency and profitability. These ratios do not necessarly indicate liquidity issues and need to be evaluated against the specifics of the business.
Analyzing Profitability Metrics
ChartMill assigns a proprietary Profitability Rating to each stock. The score is computed by evaluating various profitability ratios and margins and ranges from 0 to 10. NYSE:HUBB was assigned a score of 9 for profitability:
- HUBB has a better Return On Assets (10.64%) than 94.44% of its industry peers.
- HUBB has a Return On Equity of 23.94%. This is amongst the best in the industry. HUBB outperforms 93.33% of its industry peers.
- The Return On Invested Capital of HUBB (14.33%) is better than 94.44% of its industry peers.
- The last Return On Invested Capital (14.33%) for HUBB is above the 3 year average (12.44%), which is a sign of increasing profitability.
- HUBB has a better Profit Margin (13.11%) than 91.11% of its industry peers.
- In the last couple of years the Profit Margin of HUBB has grown nicely.
- HUBB's Operating Margin of 18.74% is amongst the best of the industry. HUBB outperforms 94.44% of its industry peers.
- In the last couple of years the Operating Margin of HUBB has grown nicely.
- HUBB's Gross Margin of 34.25% is amongst the best of the industry. HUBB outperforms 81.11% of its industry peers.
- HUBB's Gross Margin has improved in the last couple of years.
More Best Dividend stocks can be found in our Best Dividend screener.
Check the latest full fundamental report of HUBB for a complete fundamental analysis.
Disclaimer
This is not investing advice! The article highlights some of the observations at the time of writing, but you should always make your own analysis and invest based on your own insights.
