
When you look at NYSE:HRB, it's hard to ignore the strong fundamentals, especially considering its likely undervaluation.
By Mill Chart
Last update: Oct 16, 2024
Our stock screening tool has pinpointed H&R BLOCK INC (NYSE:HRB) as an undervalued stock. NYSE:HRB maintains a solid financial footing. Furthermore, it remains attractively priced. Let's delve into the specifics below.
Valuation Examination for NYSE:HRB
ChartMill employs its own Valuation Rating system for all stocks. This score, ranging from 0 to 10, is determined by evaluating different valuation factors, including price to earnings and free cash flow, both in absolute terms and relative to the market and industry. NYSE:HRB has earned a 8 for valuation:
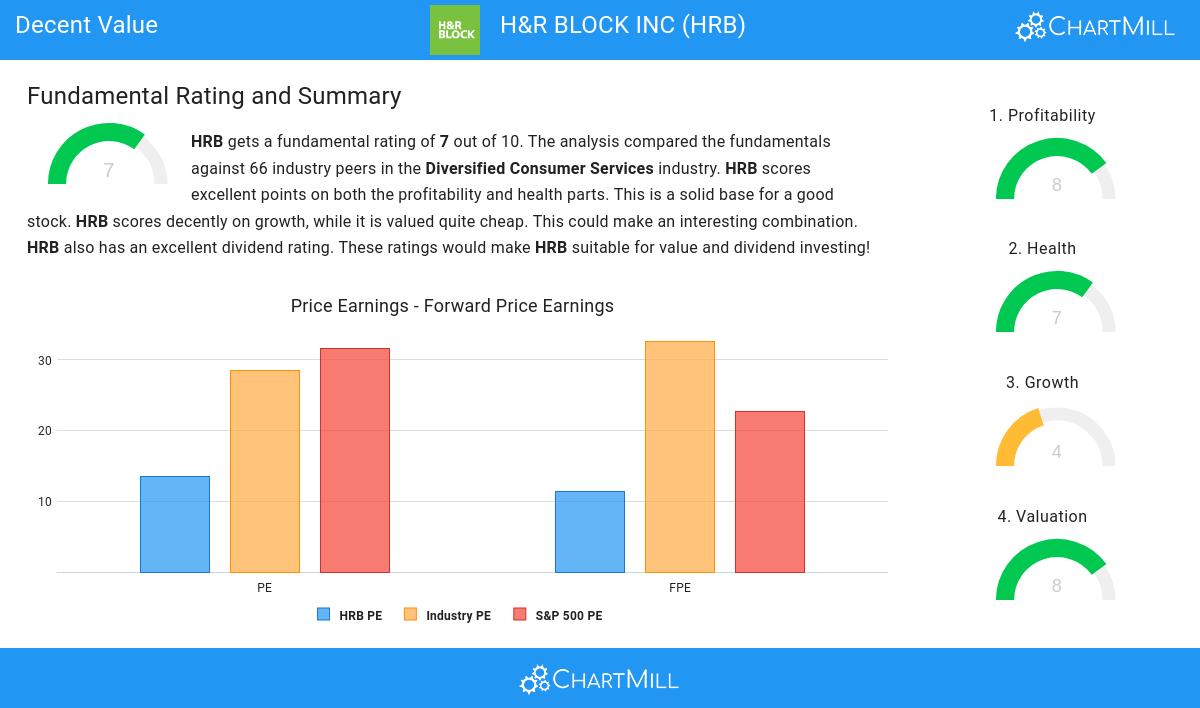
- Based on the Price/Earnings ratio, HRB is valued cheaper than 84.38% of the companies in the same industry.
- When comparing the Price/Earnings ratio of HRB to the average of the S&P500 Index (31.61), we can say HRB is valued rather cheaply.
- Based on the Price/Forward Earnings ratio of 11.44, the valuation of HRB can be described as reasonable.
- Based on the Price/Forward Earnings ratio, HRB is valued cheaper than 85.94% of the companies in the same industry.
- When comparing the Price/Forward Earnings ratio of HRB to the average of the S&P500 Index (22.63), we can say HRB is valued slightly cheaper.
- HRB's Enterprise Value to EBITDA ratio is a bit cheaper when compared to the industry. HRB is cheaper than 60.94% of the companies in the same industry.
- HRB's Price/Free Cash Flow ratio is rather cheap when compared to the industry. HRB is cheaper than 85.94% of the companies in the same industry.
- HRB's low PEG Ratio(NY), which compensates the Price/Earnings for growth, indicates a rather cheap valuation of the company.
- HRB has an outstanding profitability rating, which may justify a higher PE ratio.
Profitability Insights: NYSE:HRB
ChartMill's Profitability Rating offers a unique perspective on stock analysis, providing scores from 0 to 10. These ratings consider a wide range of profitability metrics and margins, both in comparison to industry peers and on their own merits. For NYSE:HRB, the assigned 8 is a significant indicator of profitability:
- With an excellent Return On Assets value of 13.33%, HRB belongs to the best of the industry, outperforming 90.63% of the companies in the same industry.
- With an excellent Return On Equity value of 473.79%, HRB belongs to the best of the industry, outperforming 100.00% of the companies in the same industry.
- The Return On Invested Capital of HRB (21.03%) is better than 92.19% of its industry peers.
- The Average Return On Invested Capital over the past 3 years for HRB is significantly above the industry average of 11.90%.
- The last Return On Invested Capital (21.03%) for HRB is well below the 3 year average (27.24%), which needs to be investigated, but indicates that HRB had better years and this may not be a problem.
- With an excellent Profit Margin value of 11.31%, HRB belongs to the best of the industry, outperforming 82.81% of the companies in the same industry.
- In the last couple of years the Profit Margin of HRB has grown nicely.
- HRB's Operating Margin of 15.79% is fine compared to the rest of the industry. HRB outperforms 79.69% of its industry peers.
- In the last couple of years the Operating Margin of HRB has grown nicely.
Understanding NYSE:HRB's Health
ChartMill assigns a proprietary Health Rating to each stock. The score is computed by evaluating various liquidity and solvency ratios and ranges from 0 to 10. NYSE:HRB was assigned a score of 7 for health:
- HRB has an Altman-Z score of 3.51. This indicates that HRB is financially healthy and has little risk of bankruptcy at the moment.
- HRB has a better Altman-Z score (3.51) than 81.25% of its industry peers.
- The Debt to FCF ratio of HRB is 2.27, which is a good value as it means it would take HRB, 2.27 years of fcf income to pay off all of its debts.
- The Debt to FCF ratio of HRB (2.27) is better than 75.00% of its industry peers.
- Even though the debt/equity ratio score it not favorable for HRB, it has very limited outstanding debt, so we won't put too much weight on the DE evaluation.
Evaluating Growth: NYSE:HRB
ChartMill employs its own Growth Rating system for all stocks. This score, ranging from 0 to 10, is derived by evaluating different growth factors, such as EPS and revenue growth, taking into account both past performance and future projections. NYSE:HRB has earned a 4 for growth:
- HRB shows a strong growth in Earnings Per Share. In the last year, the EPS has been growing by 15.94%, which is quite good.
- HRB shows quite a strong growth in Earnings Per Share. Measured over the last years, the EPS has been growing by 15.54% yearly.
- The Revenue has grown by 9.28% in the past year. This is quite good.
Our Decent Value screener lists more Decent Value stocks and is updated daily.
Check the latest full fundamental report of HRB for a complete fundamental analysis.
Disclaimer
This is not investing advice! The article highlights some of the observations at the time of writing, but you should always make your own analysis and invest based on your own insights.
43.28
-0.67 (-1.52%)
Find more stocks in the Stock Screener
HRB Latest News and Analysis

