
A technical analysis of H&R BLOCK INC.
By Mill Chart
Last update: Oct 4, 2024
H&R BLOCK INC (NYSE:HRB) was identified as a Technical Breakout Setup Pattern by our stockscreener. Such a pattern occurs when we see a pause in a strong uptrend: after a strong rise the stock is consolidating a bit and at some point the trend may be continued. Whether this actually happens can not be predicted of course, but it may be a good idea to keep and eye on NYSE:HRB.
Technical analysis of NYSE:HRB
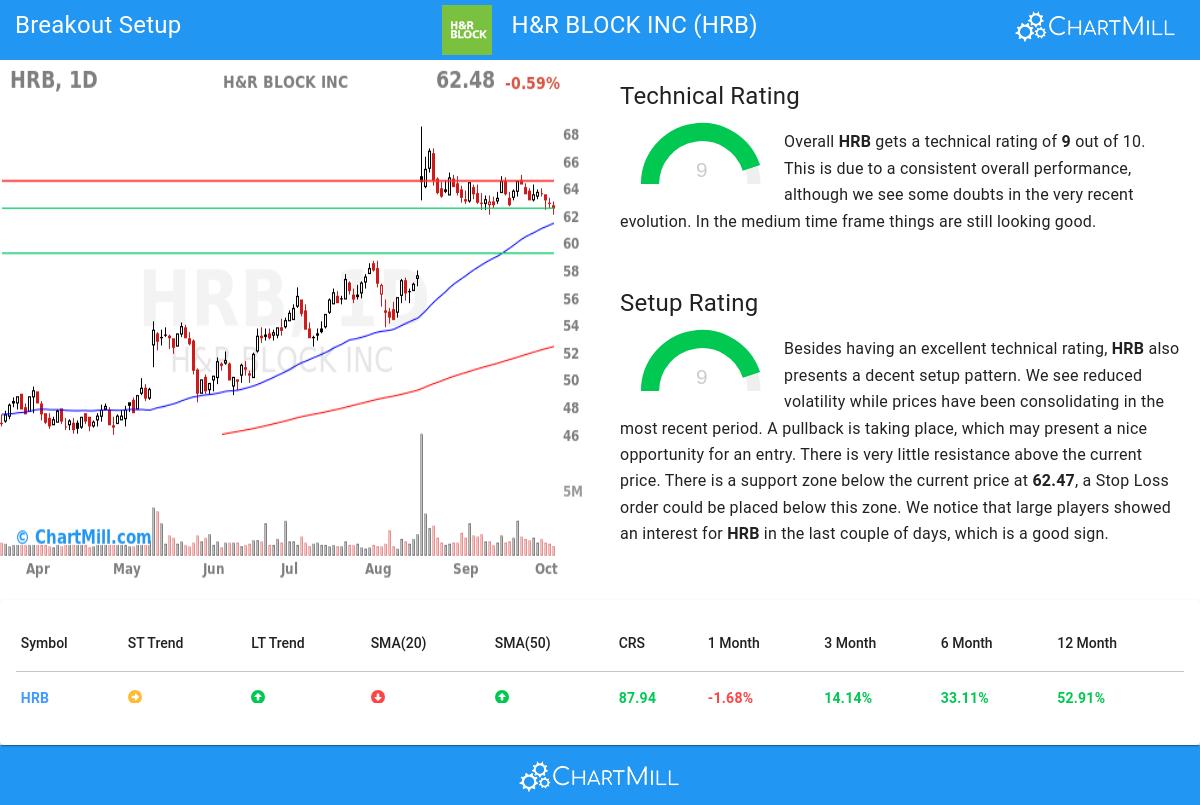
ChartMill assigns a Technical Rating to every stock. This score, ranging from 0 to 10, is updated daily and is determined by evaluating multiple technical indicators and properties.
We assign a technical rating of 9 out of 10 to HRB. In the last year, HRB was one of the better performers, but we do observe some doubts in the very recent evolution.
- The long term trend is positive and the short term trend is neutral. The long term trend gets the benefit of the doubt for now.
- Looking at the yearly performance, HRB did better than 87% of all other stocks. We also observe that the gains produced by HRB over the past year are nicely spread over this period.
- HRB is one of the better performing stocks in the Diversified Consumer Services industry, it outperforms 79% of 65 stocks in the same industry.
- HRB is currently trading in the upper part of its 52 week range. The S&P500 Index however is currently trading near a new high, so HRB is lagging the market slightly.
- HRB is currently showing a bull flag pattern! A bull flag pattern occurs when prices pull back slightly after a strong rise up. This may be a nice opportunity for an entry.
- In the last month HRB has a been trading in a tight range between 61.95 and 64.90.
Check the latest full technical report of HRB for a complete technical analysis.
How do we evaluate the setup for NYSE:HRB?
ChartMill takes into account not only the Technical Rating but also assigns a Setup Rating to each stock. This rating, on a scale of 0 to 10, reflects the degree of consolidation observed based on short-term technical indicators. Currently, NYSE:HRB exhibits a 9 setup rating, indicating its consolidation status in recent days and weeks.
Besides having an excellent technical rating, HRB also presents a decent setup pattern. Prices have been consolidating lately and the volatility has been reduced. A pullback is taking place, which may present a nice opportunity for an entry. There is very little resistance above the current price. There is a support zone below the current price at 62.47, a Stop Loss order could be placed below this zone. We notice that large players showed an interest for HRB in the last couple of days, which is a good sign.
How to trade NYSE:HRB?
A breakout opportunity may arise when the stock surpasses the current consolidation zone and reaches new highs. Traders often wait for this breakout before considering buying the stock. To manage risk, a stop loss order could be placed below the consolidation zone to limit potential losses.
This article should in no way be interpreted as trading advice. You should always make your own analysis and trade or not trade based on your own observations and style. The article is based purely on some technical observations.
Our Breakout screener lists more breakout setups and is updated daily.
Keep in mind
Important Note: The content of this article is not intended as trading advice. It is essential to perform your own analysis and exercise caution when making trading decisions. The article presents observations created by automated analysis but does not guarantee any trading or investment outcomes. Always trade responsibly and make independent judgments.
