
NYSE:HRB: good value for what you're paying.
By Mill Chart
Last update: Sep 20, 2024
Our stock screener has spotted H&R BLOCK INC (NYSE:HRB) as an undervalued stock with solid fundamentals. NYSE:HRB shows decent health and profitability. At the same time it remains remains attractively priced. We'll dive into each aspect below.
Evaluating Valuation: NYSE:HRB
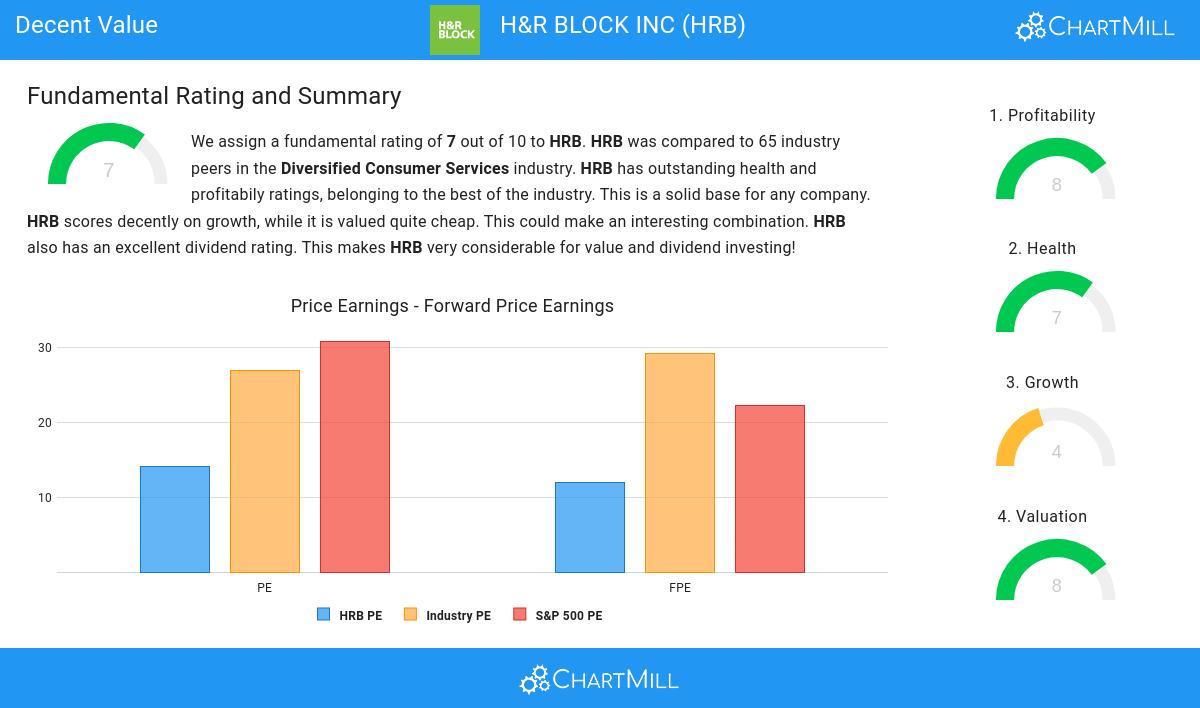
ChartMill provides a Valuation Rating to every stock, ranging from 0 to 10. This rating assesses various valuation aspects, comparing price to earnings and cash flows, while considering factors like profitability and growth. NYSE:HRB boasts a 8 out of 10:
- HRB's Price/Earnings ratio is rather cheap when compared to the industry. HRB is cheaper than 82.81% of the companies in the same industry.
- Compared to an average S&P500 Price/Earnings ratio of 30.79, HRB is valued rather cheaply.
- HRB is valuated reasonably with a Price/Forward Earnings ratio of 11.98.
- HRB's Price/Forward Earnings ratio is rather cheap when compared to the industry. HRB is cheaper than 85.94% of the companies in the same industry.
- HRB is valuated rather cheaply when we compare the Price/Forward Earnings ratio to 22.21, which is the current average of the S&P500 Index.
- Compared to the rest of the industry, the Enterprise Value to EBITDA ratio of HRB indicates a somewhat cheap valuation: HRB is cheaper than 62.50% of the companies listed in the same industry.
- Compared to the rest of the industry, the Price/Free Cash Flow ratio of HRB indicates a rather cheap valuation: HRB is cheaper than 82.81% of the companies listed in the same industry.
- The low PEG Ratio(NY), which compensates the Price/Earnings for growth, indicates a rather cheap valuation of the company.
- HRB has an outstanding profitability rating, which may justify a higher PE ratio.
Profitability Analysis for NYSE:HRB
ChartMill utilizes a Profitability Rating to assess stocks, scoring them on a scale of 0 to 10. This rating takes into account a variety of profitability ratios and margins, both in absolute terms and in comparison to industry peers. NYSE:HRB has earned a 8 out of 10:
- The Return On Assets of HRB (13.33%) is better than 90.63% of its industry peers.
- HRB has a Return On Equity of 473.79%. This is amongst the best in the industry. HRB outperforms 100.00% of its industry peers.
- HRB has a Return On Invested Capital of 21.03%. This is amongst the best in the industry. HRB outperforms 92.19% of its industry peers.
- HRB had an Average Return On Invested Capital over the past 3 years of 27.24%. This is significantly above the industry average of 11.90%.
- The last Return On Invested Capital (21.03%) for HRB is well below the 3 year average (27.24%), which needs to be investigated, but indicates that HRB had better years and this may not be a problem.
- HRB has a Profit Margin of 11.31%. This is amongst the best in the industry. HRB outperforms 82.81% of its industry peers.
- HRB's Profit Margin has improved in the last couple of years.
- Looking at the Operating Margin, with a value of 15.79%, HRB is in the better half of the industry, outperforming 79.69% of the companies in the same industry.
- In the last couple of years the Operating Margin of HRB has grown nicely.
Evaluating Health: NYSE:HRB
ChartMill employs its own Health Rating for stock assessment. This rating, ranging from 0 to 10, is calculated by examining various liquidity and solvency ratios. In the case of NYSE:HRB, the assigned 7 reflects its health status:
- An Altman-Z score of 3.60 indicates that HRB is not in any danger for bankruptcy at the moment.
- With an excellent Altman-Z score value of 3.60, HRB belongs to the best of the industry, outperforming 81.25% of the companies in the same industry.
- The Debt to FCF ratio of HRB is 2.27, which is a good value as it means it would take HRB, 2.27 years of fcf income to pay off all of its debts.
- HRB has a better Debt to FCF ratio (2.27) than 76.56% of its industry peers.
- Even though the debt/equity ratio score it not favorable for HRB, it has very limited outstanding debt, so we won't put too much weight on the DE evaluation.
Growth Analysis for NYSE:HRB
ChartMill assigns a proprietary Growth Rating to each stock. The score is computed by evaluating various growth aspects, like EPS and revenue growth. We take into account the history as well as the estimated future numbers. NYSE:HRB was assigned a score of 4 for growth:
- The Earnings Per Share has grown by an nice 15.94% over the past year.
- The Earnings Per Share has been growing by 15.54% on average over the past years. This is quite good.
- HRB shows quite a strong growth in Revenue. In the last year, the Revenue has grown by 9.28%.
Every day, new Decent Value stocks can be found on ChartMill in our Decent Value screener.
Check the latest full fundamental report of HRB for a complete fundamental analysis.
Keep in mind
This is not investing advice! The article highlights some of the observations at the time of writing, but you should always make your own analysis and invest based on your own insights.