
HAMILTON INSURANCE GROU-CL B (NYSE:HG) stands out as a growth opportunity that won't break the bank.
By Mill Chart
Last update: Apr 3, 2025
Our stock screener has singled out HAMILTON INSURANCE GROU-CL B (NYSE:HG) as an attractive growth opportunity. HG is demonstrating remarkable growth potential while maintaining strong financial indicators, making it a reasonably priced option. We'll explore this further.
Growth Analysis for HG
ChartMill employs its own Growth Rating system for all stocks. This score, ranging from 0 to 10, is derived by evaluating different growth factors, such as EPS and revenue growth, taking into account both past performance and future projections. HG has earned a 7 for growth:
- The Earnings Per Share has grown by an impressive 53.41% over the past year.
- HG shows a strong growth in Revenue. In the last year, the Revenue has grown by 51.90%.
- The Revenue has been growing by 176.06% on average over the past years. This is a very strong growth!
- Based on estimates for the next years, HG will show a quite strong growth in Earnings Per Share. The EPS will grow by 9.50% on average per year.
- HG is expected to show quite a strong growth in Revenue. In the coming years, the Revenue will grow by 10.98% yearly.
A Closer Look at Valuation for HG
An integral part of ChartMill's stock analysis is the Valuation Rating, which spans from 0 to 10. This rating evaluates diverse valuation factors, including price to earnings and cash flows, while considering the stock's profitability and growth. HG has received a 8 out of 10:
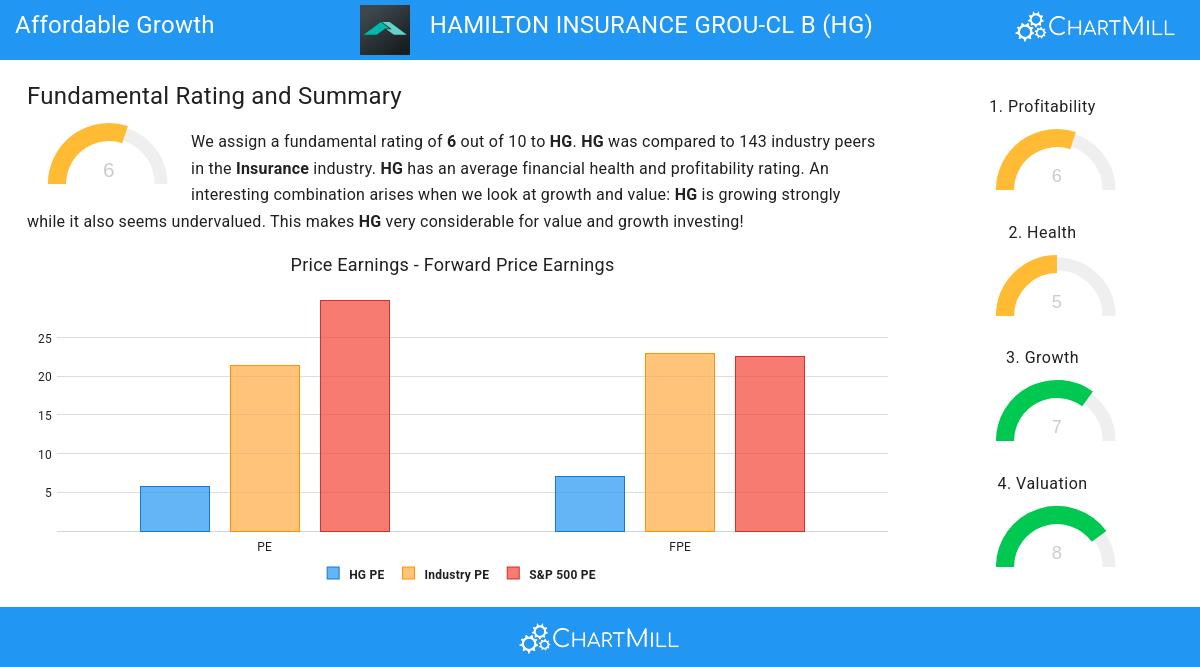
- Based on the Price/Earnings ratio of 5.81, the valuation of HG can be described as very cheap.
- HG's Price/Earnings ratio is rather cheap when compared to the industry. HG is cheaper than 80.42% of the companies in the same industry.
- When comparing the Price/Earnings ratio of HG to the average of the S&P500 Index (29.85), we can say HG is valued rather cheaply.
- The Price/Forward Earnings ratio is 7.09, which indicates a rather cheap valuation of HG.
- Based on the Price/Forward Earnings ratio, HG is valued a bit cheaper than 78.32% of the companies in the same industry.
- Compared to an average S&P500 Price/Forward Earnings ratio of 22.57, HG is valued rather cheaply.
- 93.01% of the companies in the same industry are more expensive than HG, based on the Enterprise Value to EBITDA ratio.
- Based on the Price/Free Cash Flow ratio, HG is valued cheaply inside the industry as 82.52% of the companies are valued more expensively.
- The decent profitability rating of HG may justify a higher PE ratio.
Looking at the Health
Every stock is evaluated by ChartMill, receiving a Health Rating on a scale of 0 to 10. This assessment considers different health aspects, including liquidity and solvency, both in absolute terms and relative to industry peers. HG has achieved a 5 out of 10:
- HG has a Altman-Z score of 0.95. This is in the better half of the industry: HG outperforms 79.72% of its industry peers.
- The Debt to FCF ratio of HG is 0.20, which is an excellent value as it means it would take HG, only 0.20 years of fcf income to pay off all of its debts.
- HG has a Debt to FCF ratio of 0.20. This is amongst the best in the industry. HG outperforms 91.61% of its industry peers.
- A Debt/Equity ratio of 0.06 indicates that HG is not too dependend on debt financing.
- HG has a Debt to Equity ratio of 0.06. This is amongst the best in the industry. HG outperforms 82.52% of its industry peers.
- HG has a better Current ratio (0.18) than 69.23% of its industry peers.
- With a decent Quick ratio value of 0.18, HG is doing good in the industry, outperforming 69.23% of the companies in the same industry.
How do we evaluate the Profitability for HG?
Discover ChartMill's exclusive Profitability Rating, a proprietary metric that assesses stocks on a scale of 0 to 10. It takes into consideration various profitability ratios and margins, both in absolute terms and relative to industry peers. Notably, HG has achieved a 6:
- HG's Return On Assets of 5.14% is amongst the best of the industry. HG outperforms 83.22% of its industry peers.
- The Return On Equity of HG (17.20%) is better than 72.73% of its industry peers.
- HG has a Return On Invested Capital of 6.45%. This is amongst the best in the industry. HG outperforms 85.31% of its industry peers.
- The last Return On Invested Capital (6.45%) for HG is above the 3 year average (3.57%), which is a sign of increasing profitability.
- HG's Profit Margin of 17.49% is amongst the best of the industry. HG outperforms 83.22% of its industry peers.
- With an excellent Operating Margin value of 26.38%, HG belongs to the best of the industry, outperforming 90.91% of the companies in the same industry.
- In the last couple of years the Operating Margin of HG has grown nicely.
Every day, new Affordable Growth stocks can be found on ChartMill in our Affordable Growth screener.
For an up to date full fundamental analysis you can check the fundamental report of HG
Keep in mind
This article should in no way be interpreted as advice. The article is based on the observed metrics at the time of writing, but you should always make your own analysis and trade or invest at your own responsibility.
