
NYSE:HG stands out as a growth opportunity that won't break the bank.
By Mill Chart
Last update: Sep 26, 2024
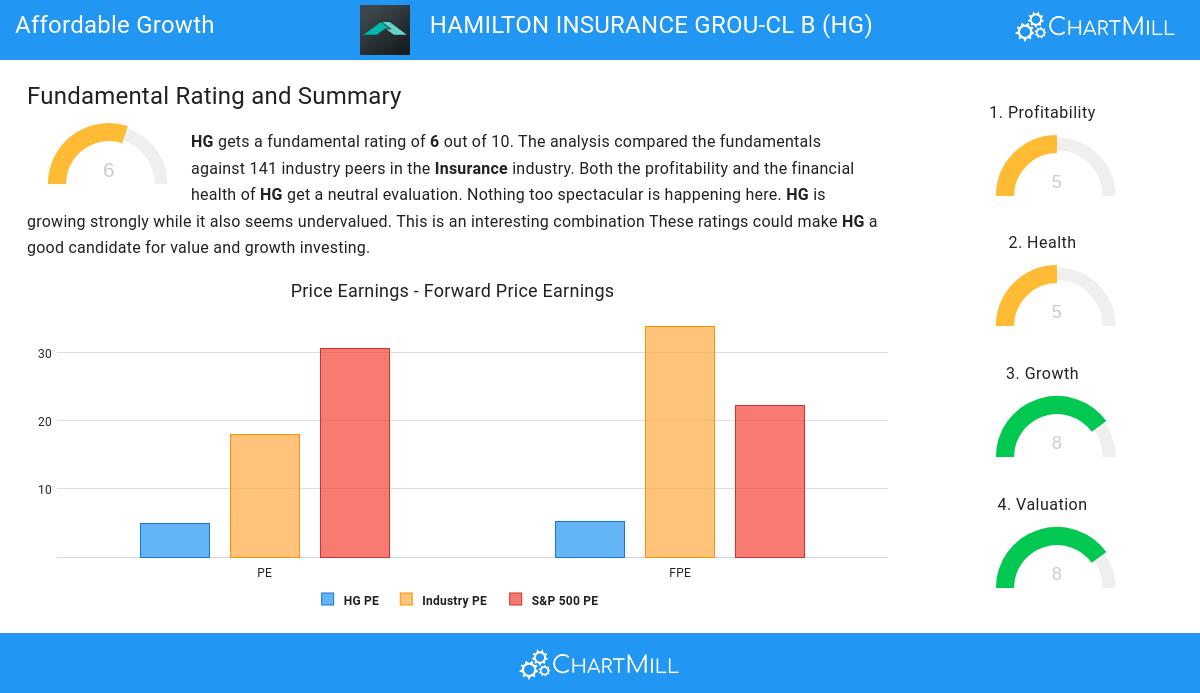
Our stock screener has spotted HAMILTON INSURANCE GROU-CL B (NYSE:HG) as a growth stock which is not overvalued. NYSE:HG is scoring great on several growth aspects while it also shows decent health and profitability. At the same time it remains remains attractively priced. We'll dive into each aspect below.
Growth Analysis for NYSE:HG
A key component of ChartMill's stock assessment is the Growth Rating, which spans from 0 to 10. This rating evaluates diverse growth factors, such as EPS and revenue growth, considering both past performance and future projections. NYSE:HG has received a 8 out of 10:
- The Earnings Per Share has grown by an impressive 373.73% over the past year.
- HG shows quite a strong growth in Revenue. In the last year, the Revenue has grown by 13.87%.
- The Revenue has been growing by 33.34% on average over the past years. This is a very strong growth!
- HG is expected to show a strong growth in Earnings Per Share. In the coming years, the EPS will grow by 30.62% yearly.
- HG is expected to show a strong growth in Revenue. In the coming years, the Revenue will grow by 23.82% yearly.
Evaluating Valuation: NYSE:HG
An integral part of ChartMill's stock analysis is the Valuation Rating, which spans from 0 to 10. This rating evaluates diverse valuation factors, including price to earnings and cash flows, while considering the stock's profitability and growth. NYSE:HG has received a 8 out of 10:
- Based on the Price/Earnings ratio of 4.92, the valuation of HG can be described as very cheap.
- Based on the Price/Earnings ratio, HG is valued cheaper than 81.30% of the companies in the same industry.
- The average S&P500 Price/Earnings ratio is at 30.63. HG is valued rather cheaply when compared to this.
- With a Price/Forward Earnings ratio of 5.23, the valuation of HG can be described as very cheap.
- Compared to the rest of the industry, the Price/Forward Earnings ratio of HG indicates a somewhat cheap valuation: HG is cheaper than 79.86% of the companies listed in the same industry.
- HG is valuated cheaply when we compare the Price/Forward Earnings ratio to 22.19, which is the current average of the S&P500 Index.
- Based on the Enterprise Value to EBITDA ratio, HG is valued cheaply inside the industry as 89.93% of the companies are valued more expensively.
- Based on the Price/Free Cash Flow ratio, HG is valued a bit cheaper than the industry average as 78.42% of the companies are valued more expensively.
- HG's low PEG Ratio(NY), which compensates the Price/Earnings for growth, indicates a rather cheap valuation of the company.
- A more expensive valuation may be justified as HG's earnings are expected to grow with 30.62% in the coming years.
Understanding NYSE:HG's Health Score
To gauge a stock's financial health, ChartMill utilizes a Health Rating on a scale of 0 to 10. This comprehensive evaluation encompasses liquidity and solvency, both in absolute terms and in comparison to industry peers. NYSE:HG has earned a 5 out of 10:
- HG's Altman-Z score of 0.86 is amongst the best of the industry. HG outperforms 81.30% of its industry peers.
- HG has a debt to FCF ratio of 0.29. This is a very positive value and a sign of high solvency as it would only need 0.29 years to pay back of all of its debts.
- HG has a Debt to FCF ratio of 0.29. This is amongst the best in the industry. HG outperforms 92.81% of its industry peers.
- A Debt/Equity ratio of 0.07 indicates that HG is not too dependend on debt financing.
- HG's Debt to Equity ratio of 0.07 is amongst the best of the industry. HG outperforms 85.61% of its industry peers.
- The Current ratio of HG (0.04) is better than 64.75% of its industry peers.
- With a decent Quick ratio value of 0.04, HG is doing good in the industry, outperforming 64.75% of the companies in the same industry.
Profitability Assessment of NYSE:HG
ChartMill employs its own Profitability Rating system for stock evaluation. This score, ranging from 0 to 10, is derived from an analysis of diverse profitability metrics and margins. In the case of NYSE:HG, the assigned 5 is noteworthy for profitability:
- With an excellent Return On Assets value of 6.02%, HG belongs to the best of the industry, outperforming 89.21% of the companies in the same industry.
- HG has a Return On Equity of 20.49%. This is amongst the best in the industry. HG outperforms 85.61% of its industry peers.
- Looking at the Return On Invested Capital, with a value of 5.25%, HG belongs to the top of the industry, outperforming 87.05% of the companies in the same industry.
- The 3 year average ROIC (1.47%) for HG is below the current ROIC(5.25%), indicating increased profibility in the last year.
- HG has a Profit Margin of 22.71%. This is amongst the best in the industry. HG outperforms 91.37% of its industry peers.
- The Operating Margin of HG (24.06%) is better than 84.17% of its industry peers.
Our Affordable Growth screener lists more Affordable Growth stocks and is updated daily.
For an up to date full fundamental analysis you can check the fundamental report of HG
Disclaimer
This article should in no way be interpreted as advice. The article is based on the observed metrics at the time of writing, but you should always make your own analysis and trade or invest at your own responsibility.
