
Despite its impressive fundamentals, NYSE:HG remains undervalued.
By Mill Chart
Last update: Sep 26, 2024
Our stock screening tool has identified HAMILTON INSURANCE GROU-CL B (NYSE:HG) as an undervalued gem with strong fundamentals. NYSE:HG boasts decent financial health and profitability while maintaining an attractive price point. We'll break it down further.
Evaluating Valuation: NYSE:HG
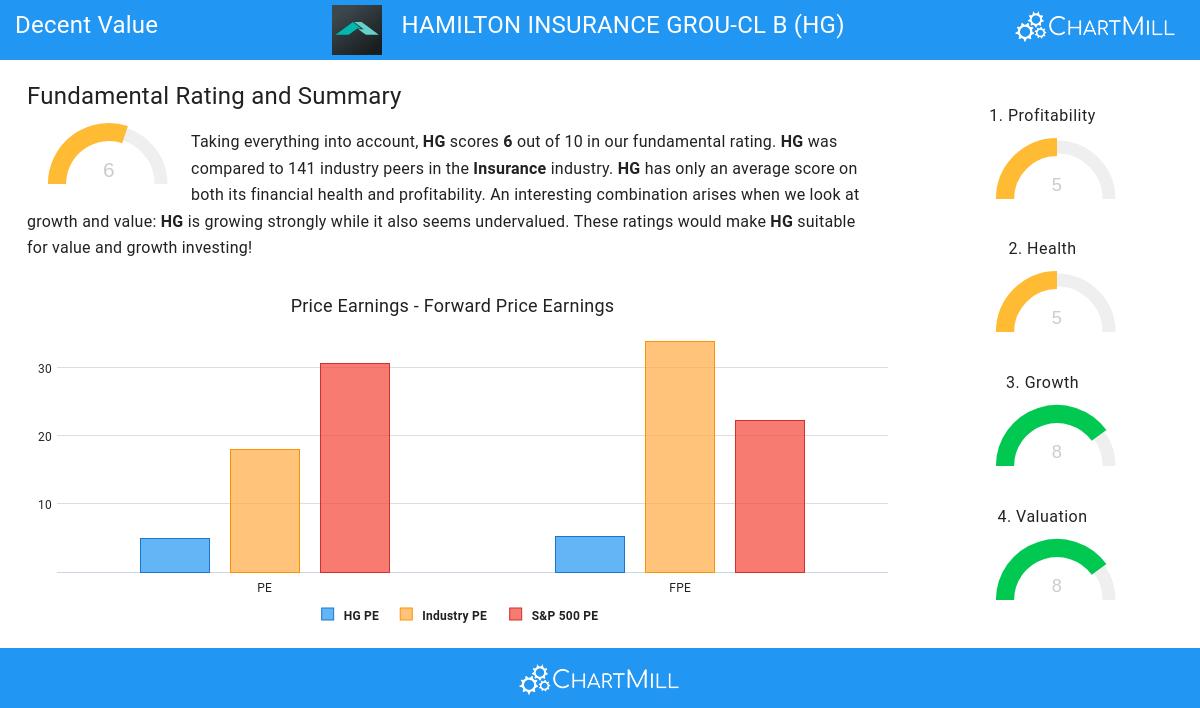
ChartMill provides a Valuation Rating to every stock, ranging from 0 to 10. This rating assesses various valuation aspects, comparing price to earnings and cash flows, while considering factors like profitability and growth. NYSE:HG boasts a 8 out of 10:
- HG is valuated cheaply with a Price/Earnings ratio of 4.92.
- HG's Price/Earnings ratio is rather cheap when compared to the industry. HG is cheaper than 81.30% of the companies in the same industry.
- The average S&P500 Price/Earnings ratio is at 30.63. HG is valued rather cheaply when compared to this.
- Based on the Price/Forward Earnings ratio of 5.23, the valuation of HG can be described as very cheap.
- 79.86% of the companies in the same industry are more expensive than HG, based on the Price/Forward Earnings ratio.
- The average S&P500 Price/Forward Earnings ratio is at 22.19. HG is valued rather cheaply when compared to this.
- 89.93% of the companies in the same industry are more expensive than HG, based on the Enterprise Value to EBITDA ratio.
- 78.42% of the companies in the same industry are more expensive than HG, based on the Price/Free Cash Flow ratio.
- The low PEG Ratio(NY), which compensates the Price/Earnings for growth, indicates a rather cheap valuation of the company.
- A more expensive valuation may be justified as HG's earnings are expected to grow with 30.62% in the coming years.
Looking at the Profitability
ChartMill's Profitability Rating offers a unique perspective on stock analysis, providing scores from 0 to 10. These ratings consider a wide range of profitability metrics and margins, both in comparison to industry peers and on their own merits. For NYSE:HG, the assigned 5 is a significant indicator of profitability:
- The Return On Assets of HG (6.02%) is better than 89.21% of its industry peers.
- HG's Return On Equity of 20.49% is amongst the best of the industry. HG outperforms 85.61% of its industry peers.
- HG has a Return On Invested Capital of 5.25%. This is amongst the best in the industry. HG outperforms 87.05% of its industry peers.
- The 3 year average ROIC (1.47%) for HG is below the current ROIC(5.25%), indicating increased profibility in the last year.
- Looking at the Profit Margin, with a value of 22.71%, HG belongs to the top of the industry, outperforming 91.37% of the companies in the same industry.
- HG has a better Operating Margin (24.06%) than 84.17% of its industry peers.
ChartMill's Evaluation of Health
ChartMill employs a unique Health Rating system for all stocks. This rating, ranging from 0 to 10, is determined by analyzing various liquidity and solvency ratios. For NYSE:HG, the assigned 5 for health provides valuable insights:
- HG's Altman-Z score of 0.86 is amongst the best of the industry. HG outperforms 81.30% of its industry peers.
- The Debt to FCF ratio of HG is 0.29, which is an excellent value as it means it would take HG, only 0.29 years of fcf income to pay off all of its debts.
- With an excellent Debt to FCF ratio value of 0.29, HG belongs to the best of the industry, outperforming 92.81% of the companies in the same industry.
- A Debt/Equity ratio of 0.07 indicates that HG is not too dependend on debt financing.
- With an excellent Debt to Equity ratio value of 0.07, HG belongs to the best of the industry, outperforming 85.61% of the companies in the same industry.
- The Current ratio of HG (0.04) is better than 64.75% of its industry peers.
- With a decent Quick ratio value of 0.04, HG is doing good in the industry, outperforming 64.75% of the companies in the same industry.
Growth Analysis for NYSE:HG
To evaluate a stock's growth potential, ChartMill utilizes a Growth Rating on a scale of 0 to 10. This comprehensive assessment considers various growth aspects, including historical and estimated EPS and revenue growth. NYSE:HG has achieved a 8 out of 10:
- HG shows a strong growth in Earnings Per Share. In the last year, the EPS has been growing by 373.73%, which is quite impressive.
- Looking at the last year, HG shows a quite strong growth in Revenue. The Revenue has grown by 13.87% in the last year.
- HG shows a strong growth in Revenue. Measured over the last years, the Revenue has been growing by 33.34% yearly.
- The Earnings Per Share is expected to grow by 30.62% on average over the next years. This is a very strong growth
- HG is expected to show a strong growth in Revenue. In the coming years, the Revenue will grow by 23.82% yearly.
Every day, new Decent Value stocks can be found on ChartMill in our Decent Value screener.
For an up to date full fundamental analysis you can check the fundamental report of HG
Keep in mind
Important Note: The content of this article is not intended as trading advice. It is essential to perform your own analysis and exercise caution when making trading decisions. The article presents observations created by automated analysis but does not guarantee any trading or investment outcomes. Always trade responsibly and make independent judgments.