
Exploring growth characteristics of HCI GROUP INC (NYSE:HCI).
By Mill Chart
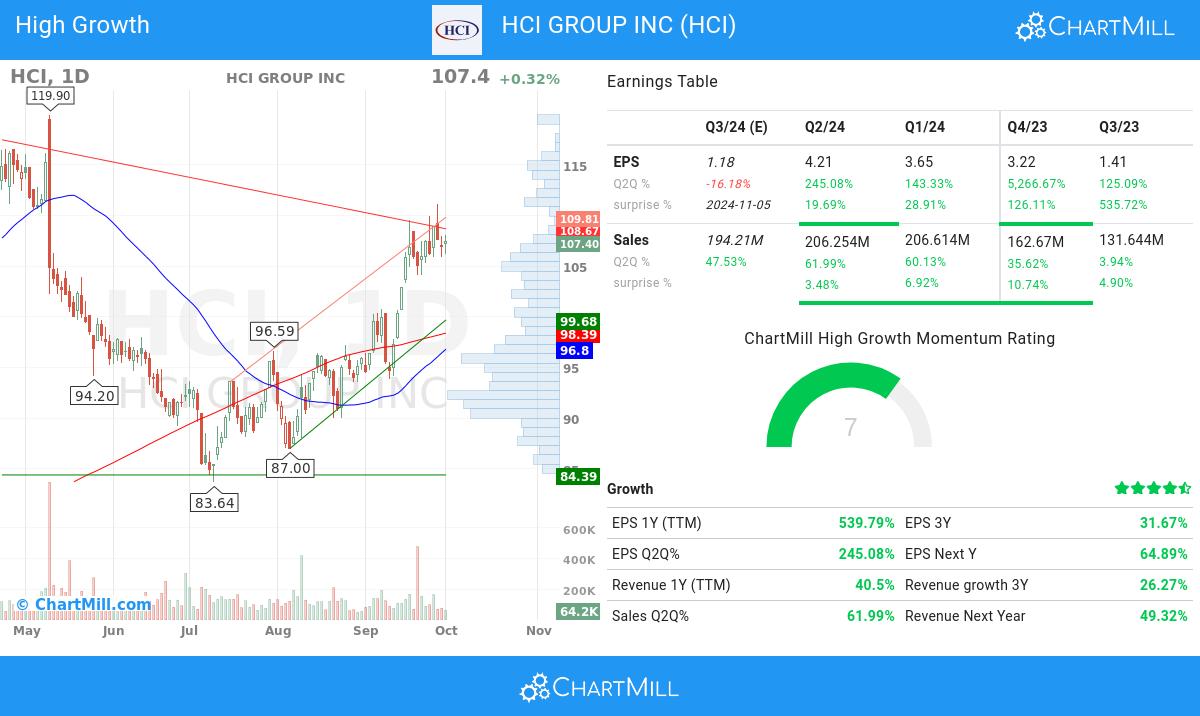
Last update: Oct 2, 2024
Groth investors are looking for stocks showing high revenue and EPS growth. We will have a look here to see if HCI GROUP INC (NYSE:HCI) is suited for growth investing. Investors should of course do their own research, but we spotted HCI GROUP INC showing up in our CANSLIM growth screen, so it may be worth spending some more time on it.
What matters for canslim investors.
- In the most recent financial report, HCI GROUP INC reported a 245.0% increase in quarterly earnings compared to the previous quarter. This notable growth indicates positive momentum in the company's financials, suggesting an upward trend
- The quarter-to-quarter (Q2Q) revenue growth of 61.99% of HCI GROUP INC has been strong, reflecting the company's ability to generate consistent sales growth. This growth suggests the company's ability to meet customer needs and drive revenue growth.
- The 3-year EPS growth of HCI GROUP INC (31.67%) highlights the company's ability to consistently improve its earnings performance and suggests a positive outlook for future profitability.
- HCI GROUP INC showcases a robust Return on Equity (ROE) of 33.1%, indicating its ability to generate favorable returns for shareholders. This metric underscores the company's efficiency in utilizing its equity capital to generate profits.
- HCI GROUP INC has maintained a healthy Relative Strength (RS) over the analyzed period, with a current 95.15 rating. This demonstrates the stock's ability to outperform its peers and indicates its competitive positioning. HCI GROUP INC is well-positioned for potential price growth opportunities.
- With a Debt-to-Equity ratio at 0.52, HCI GROUP INC showcases its prudent financial management. The company's balanced approach between debt and equity reflects its commitment to maintaining a stable capital structure.
- With institutional shareholders at 76.19%, HCI GROUP INC demonstrates a healthy ownership distribution. This reflects a mix of institutional and individual investors, creating a market environment that may foster increased trading activity and price discovery.
Deciphering the Technical Picture of NYSE:HCI
At ChartMill, a crucial aspect of their analysis is the assignment of a Technical Rating to each stock. This rating, ranging from 0 to 10, is calculated daily by considering numerous technical indicators and properties.
Taking everything into account, HCI scores 10 out of 10 in our technical rating. HCI has been one of the better performers in the overall market. Some doubts were observed in the medium time frame, but recent action was again very positive.
- The long and short term trends are both positive. This is looking good!
- When comparing the yearly performance of all stocks, we notice that HCI is one of the better performing stocks in the market, outperforming 95% of all stocks. We also observe that the gains produced by HCI over the past year are nicely spread over this period.
- HCI is one of the better performing stocks in the Insurance industry, it outperforms 94% of 140 stocks in the same industry.
- HCI is currently trading in the upper part of its 52 week range. The S&P500 Index however is currently trading near a new high, so HCI is lagging the market slightly.
- In the last month HCI has a been trading in the 93.82 - 111.13 range, which is quite wide. It is currently trading near the high of this range.
Check the latest full technical report of HCI for a complete technical analysis.
What is the full fundamental picture of NYSE:HCI telling us.
ChartMill assigns a Fundamental Rating to every stock. This score, ranging from 0 to 10, is updated daily and is determined by evaluating multiple fundamental indicators and properties.
Overall HCI gets a fundamental rating of 7 out of 10. We evaluated HCI against 140 industry peers in the Insurance industry. While HCI has a great profitability rating, there are some minor concerns on its financial health. HCI is evaluated to be cheap and growing strongly. This does not happen too often! These ratings would make HCI suitable for value and growth investing!
Our latest full fundamental report of HCI contains the most current fundamental analsysis.
More ideas for growth investing can be found on ChartMill in our CANSLIM screen.
Disclaimer
Important Note: The content of this article is not intended as trading advice. It is essential to perform your own analysis and exercise caution when making trading decisions. The article presents observations created by automated analysis but does not guarantee any trading or investment outcomes. Always trade responsibly and make independent judgments.
