
Exploring the Growth Potential of NASDAQ:HALO as It Nears a Breakout.
By Mill Chart
Last update: Oct 22, 2024
Growth investors are on the lookout for stocks displaying robust revenue and EPS growth. In this analysis, we'll assess whether HALOZYME THERAPEUTICS INC (NASDAQ:HALO) aligns with growth investing criteria, especially as it consolidates and signals a possible breakout. As always, investors should conduct their own research, but HALOZYME THERAPEUTICS INC has surfaced on our radar for growth with base formation, warranting further examination.
Unpacking NASDAQ:HALO's Growth Rating
ChartMill employs its own Growth Rating system for all stocks. This score, ranging from 0 to 10, is derived by evaluating different growth factors, such as EPS and revenue growth, taking into account both past performance and future projections. NASDAQ:HALO has earned a 8 for growth:
- HALO shows a strong growth in Earnings Per Share. In the last year, the EPS has been growing by 34.57%, which is quite impressive.
- The Earnings Per Share has been growing by 45.64% on average over the past years. This is a very strong growth
- HALO shows quite a strong growth in Revenue. In the last year, the Revenue has grown by 12.88%.
- The Revenue has been growing by 40.42% on average over the past years. This is a very strong growth!
- The Earnings Per Share is expected to grow by 25.47% on average over the next years. This is a very strong growth
- The Revenue is expected to grow by 15.95% on average over the next years. This is quite good.
Understanding NASDAQ:HALO's Health
ChartMill utilizes a Health Rating to assess stocks, scoring them on a scale of 0 to 10. This rating takes into account a variety of liquidity and solvency ratios, both in absolute terms and in comparison to industry peers. NASDAQ:HALO has earned a 7 out of 10:
- An Altman-Z score of 4.17 indicates that HALO is not in any danger for bankruptcy at the moment.
- HALO has a Altman-Z score of 4.17. This is in the better half of the industry: HALO outperforms 76.91% of its industry peers.
- The Debt to FCF ratio of HALO is 3.68, which is a good value as it means it would take HALO, 3.68 years of fcf income to pay off all of its debts.
- The Debt to FCF ratio of HALO (3.68) is better than 95.20% of its industry peers.
- A Current Ratio of 7.41 indicates that HALO has no problem at all paying its short term obligations.
- With a decent Current ratio value of 7.41, HALO is doing good in the industry, outperforming 69.09% of the companies in the same industry.
- HALO has a Quick Ratio of 6.21. This indicates that HALO is financially healthy and has no problem in meeting its short term obligations.
- HALO has a better Quick ratio (6.21) than 62.88% of its industry peers.
Profitability Assessment of NASDAQ:HALO
ChartMill's Profitability Rating offers a unique perspective on stock analysis, providing scores from 0 to 10. These ratings consider a wide range of profitability metrics and margins, both in comparison to industry peers and on their own merits. For NASDAQ:HALO, the assigned 7 is a significant indicator of profitability:
- Looking at the Return On Assets, with a value of 17.12%, HALO belongs to the top of the industry, outperforming 98.40% of the companies in the same industry.
- Looking at the Return On Equity, with a value of 116.53%, HALO belongs to the top of the industry, outperforming 99.82% of the companies in the same industry.
- With an excellent Return On Invested Capital value of 17.85%, HALO belongs to the best of the industry, outperforming 98.05% of the companies in the same industry.
- Measured over the past 3 years, the Average Return On Invested Capital for HALO is above the industry average of 13.83%.
- The 3 year average ROIC (17.78%) for HALO is below the current ROIC(17.85%), indicating increased profibility in the last year.
- With an excellent Profit Margin value of 38.62%, HALO belongs to the best of the industry, outperforming 98.40% of the companies in the same industry.
- HALO has a better Operating Margin (46.33%) than 99.64% of its industry peers.
- HALO has a Gross Margin of 79.96%. This is amongst the best in the industry. HALO outperforms 87.03% of its industry peers.
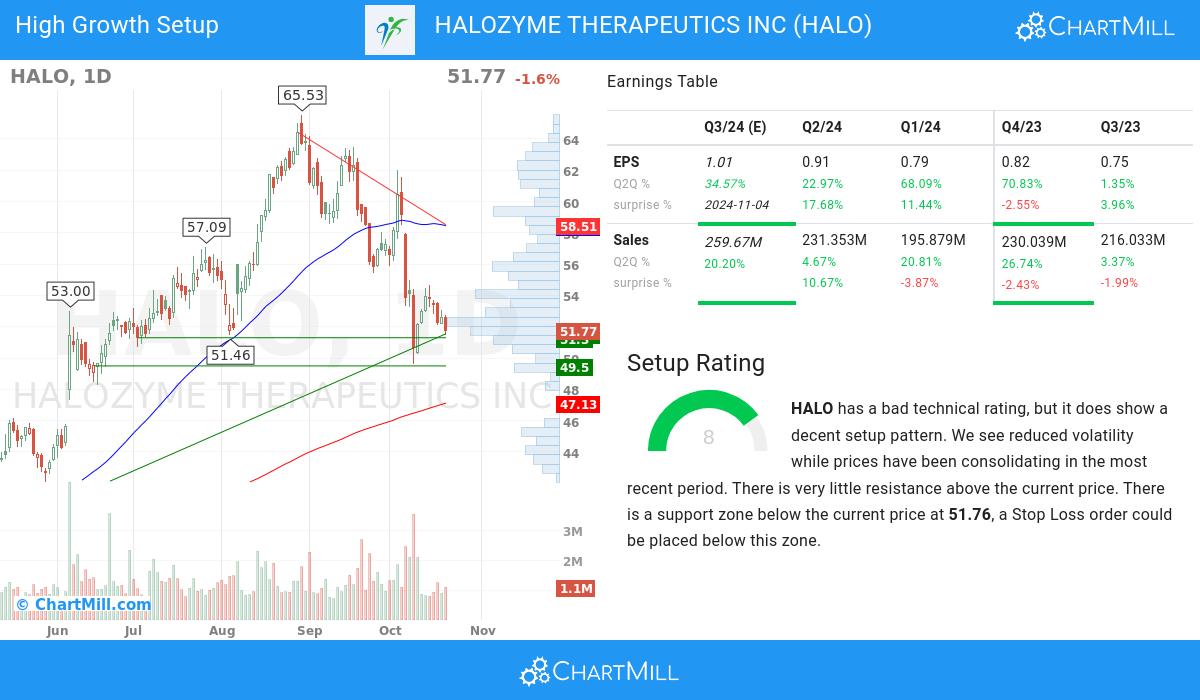
How does the Setup look for NASDAQ:HALO
In addition to the Technical Rating, ChartMill provides a Setup Rating for each stock. This rating, ranging from 0 to 10, assesses the extent of consolidation in the stock based on multiple short-term technical indicators. Currently, NASDAQ:HALO has a 8 as its setup rating:
Although the technical rating is bad, HALO does present a nice setup opportunity. Prices have been consolidating lately and the volatility has been reduced. There is very little resistance above the current price. There is a support zone below the current price at 51.76, a Stop Loss order could be placed below this zone.
Our Strong Growth screener lists more Strong Growth stocks and is updated daily.
Our latest full fundamental report of HALO contains the most current fundamental analsysis.
For an up to date full technical analysis you can check the technical report of HALO
Keep in mind
Important Note: The content of this article is not intended as trading advice. It is essential to perform your own analysis and exercise caution when making trading decisions. The article presents observations created by automated analysis but does not guarantee any trading or investment outcomes. Always trade responsibly and make independent judgments.