
Despite its growth, NASDAQ:HALO remains within the realm of affordability.
By Mill Chart
Last update: Oct 11, 2024
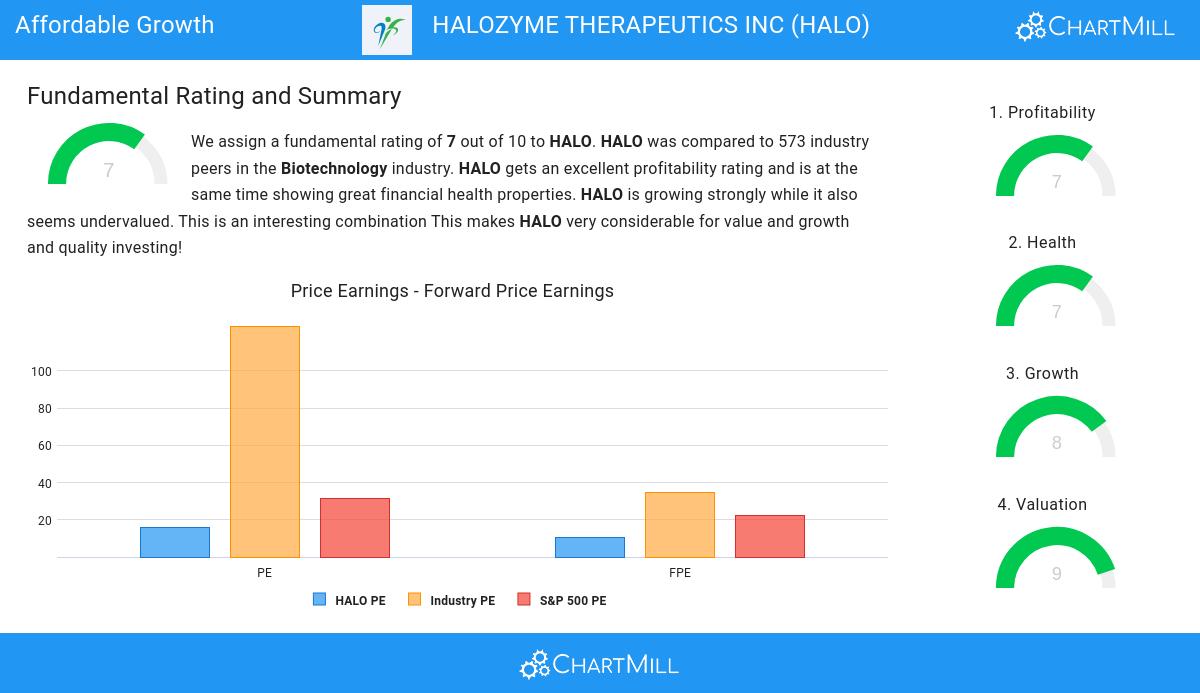
Our stock screener has spotted HALOZYME THERAPEUTICS INC (NASDAQ:HALO) as a growth stock which is not overvalued. NASDAQ:HALO is scoring great on several growth aspects while it also shows decent health and profitability. At the same time it remains remains attractively priced. We'll dive into each aspect below.
Understanding NASDAQ:HALO's Growth Score
ChartMill employs its own Growth Rating system for all stocks. This score, ranging from 0 to 10, is derived by evaluating different growth factors, such as EPS and revenue growth, taking into account both past performance and future projections. NASDAQ:HALO has earned a 8 for growth:
- The Earnings Per Share has grown by an impressive 34.57% over the past year.
- HALO shows a strong growth in Earnings Per Share. Measured over the last years, the EPS has been growing by 45.64% yearly.
- HALO shows quite a strong growth in Revenue. In the last year, the Revenue has grown by 12.88%.
- The Revenue has been growing by 40.42% on average over the past years. This is a very strong growth!
- The Earnings Per Share is expected to grow by 25.47% on average over the next years. This is a very strong growth
- The Revenue is expected to grow by 15.95% on average over the next years. This is quite good.
Valuation Examination for NASDAQ:HALO
ChartMill assigns a Valuation Rating to every stock. This score ranges from 0 to 10 and evaluates the different valuation aspects and compares the price to earnings and cash flows, while taking into account profitability and growth. NASDAQ:HALO scores a 9 out of 10:
- Compared to the rest of the industry, the Price/Earnings ratio of HALO indicates a rather cheap valuation: HALO is cheaper than 97.54% of the companies listed in the same industry.
- HALO's Price/Earnings ratio indicates a valuation a bit cheaper than the S&P500 average which is at 31.21.
- The Price/Forward Earnings ratio is 10.67, which indicates a very decent valuation of HALO.
- Based on the Price/Forward Earnings ratio, HALO is valued cheaper than 98.06% of the companies in the same industry.
- When comparing the Price/Forward Earnings ratio of HALO to the average of the S&P500 Index (22.33), we can say HALO is valued rather cheaply.
- 96.13% of the companies in the same industry are more expensive than HALO, based on the Enterprise Value to EBITDA ratio.
- 97.54% of the companies in the same industry are more expensive than HALO, based on the Price/Free Cash Flow ratio.
- The low PEG Ratio(NY), which compensates the Price/Earnings for growth, indicates a rather cheap valuation of the company.
- The decent profitability rating of HALO may justify a higher PE ratio.
- A more expensive valuation may be justified as HALO's earnings are expected to grow with 32.05% in the coming years.
Exploring NASDAQ:HALO's Health
ChartMill utilizes a Health Rating to assess stocks, scoring them on a scale of 0 to 10. This rating takes into account a variety of liquidity and solvency ratios, both in absolute terms and in comparison to industry peers. NASDAQ:HALO has earned a 7 out of 10:
- An Altman-Z score of 4.19 indicates that HALO is not in any danger for bankruptcy at the moment.
- HALO's Altman-Z score of 4.19 is fine compared to the rest of the industry. HALO outperforms 78.35% of its industry peers.
- HALO has a debt to FCF ratio of 3.68. This is a good value and a sign of high solvency as HALO would need 3.68 years to pay back of all of its debts.
- HALO has a better Debt to FCF ratio (3.68) than 95.25% of its industry peers.
- A Current Ratio of 7.41 indicates that HALO has no problem at all paying its short term obligations.
- With a decent Current ratio value of 7.41, HALO is doing good in the industry, outperforming 69.19% of the companies in the same industry.
- A Quick Ratio of 6.21 indicates that HALO has no problem at all paying its short term obligations.
- With a decent Quick ratio value of 6.21, HALO is doing good in the industry, outperforming 62.85% of the companies in the same industry.
What does the Profitability looks like for NASDAQ:HALO
Discover ChartMill's exclusive Profitability Rating, a proprietary metric that assesses stocks on a scale of 0 to 10. It takes into consideration various profitability ratios and margins, both in absolute terms and relative to industry peers. Notably, NASDAQ:HALO has achieved a 7:
- HALO has a better Return On Assets (17.12%) than 98.59% of its industry peers.
- HALO's Return On Equity of 116.53% is amongst the best of the industry. HALO outperforms 99.82% of its industry peers.
- HALO has a better Return On Invested Capital (17.85%) than 98.06% of its industry peers.
- The Average Return On Invested Capital over the past 3 years for HALO is above the industry average of 13.75%.
- The last Return On Invested Capital (17.85%) for HALO is above the 3 year average (17.78%), which is a sign of increasing profitability.
- With an excellent Profit Margin value of 38.62%, HALO belongs to the best of the industry, outperforming 98.59% of the companies in the same industry.
- With an excellent Operating Margin value of 46.33%, HALO belongs to the best of the industry, outperforming 99.65% of the companies in the same industry.
- Looking at the Gross Margin, with a value of 79.96%, HALO belongs to the top of the industry, outperforming 86.97% of the companies in the same industry.
More Affordable Growth stocks can be found in our Affordable Growth screener.
For an up to date full fundamental analysis you can check the fundamental report of HALO
Disclaimer
This is not investing advice! The article highlights some of the observations at the time of writing, but you should always make your own analysis and invest based on your own insights.