
NASDAQ:HALO is showing good growth, while it is not too expensive.
By Mill Chart
Last update: Sep 19, 2024
HALOZYME THERAPEUTICS INC (NASDAQ:HALO) was identified as an affordable growth stock by our stock screener. NASDAQ:HALO is showing great growth, but also scores well on profitability, solvency and liquidity. At the same time it seems to be priced reasonably. We'll explore this a bit deeper below.
Analyzing Growth Metrics
ChartMill assigns a proprietary Growth Rating to each stock. The score is computed by evaluating various growth aspects, like EPS and revenue growth. We take into account the history as well as the estimated future numbers. NASDAQ:HALO was assigned a score of 8 for growth:
- The Earnings Per Share has grown by an impressive 34.57% over the past year.
- Measured over the past years, HALO shows a very strong growth in Earnings Per Share. The EPS has been growing by 45.64% on average per year.
- HALO shows quite a strong growth in Revenue. In the last year, the Revenue has grown by 12.88%.
- Measured over the past years, HALO shows a very strong growth in Revenue. The Revenue has been growing by 40.42% on average per year.
- Based on estimates for the next years, HALO will show a very strong growth in Earnings Per Share. The EPS will grow by 25.47% on average per year.
- Based on estimates for the next years, HALO will show a quite strong growth in Revenue. The Revenue will grow by 15.95% on average per year.
ChartMill's Evaluation of Valuation
ChartMill assigns a Valuation Rating to each stock, ranging from 0 to 10. This rating is calculated by analyzing different valuation elements, such as price to earnings and free cash flow, both in absolute terms and relative to the market and industry. In the case of NASDAQ:HALO, the assigned 8 reflects its valuation:
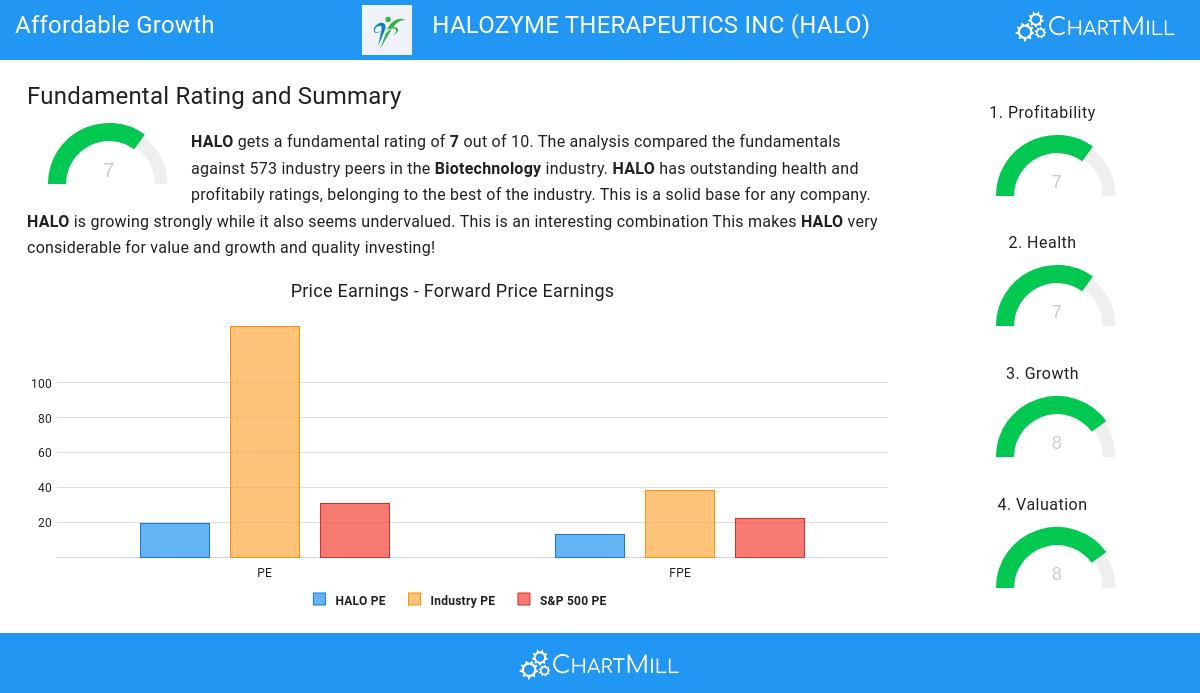
- HALO's Price/Earnings ratio is rather cheap when compared to the industry. HALO is cheaper than 96.83% of the companies in the same industry.
- HALO's Price/Earnings ratio indicates a valuation a bit cheaper than the S&P500 average which is at 30.45.
- 96.65% of the companies in the same industry are more expensive than HALO, based on the Price/Forward Earnings ratio.
- HALO's Price/Forward Earnings ratio indicates a valuation a bit cheaper than the S&P500 average which is at 21.99.
- Based on the Enterprise Value to EBITDA ratio, HALO is valued cheaper than 95.95% of the companies in the same industry.
- Based on the Price/Free Cash Flow ratio, HALO is valued cheaply inside the industry as 97.18% of the companies are valued more expensively.
- The low PEG Ratio(NY), which compensates the Price/Earnings for growth, indicates a rather cheap valuation of the company.
- HALO has a very decent profitability rating, which may justify a higher PE ratio.
- HALO's earnings are expected to grow with 32.05% in the coming years. This may justify a more expensive valuation.
Unpacking NASDAQ:HALO's Health Rating
ChartMill utilizes a Health Rating to assess stocks, scoring them on a scale of 0 to 10. This rating takes into account a variety of liquidity and solvency ratios, both in absolute terms and in comparison to industry peers. NASDAQ:HALO has earned a 7 out of 10:
- HALO has an Altman-Z score of 4.65. This indicates that HALO is financially healthy and has little risk of bankruptcy at the moment.
- HALO has a Altman-Z score of 4.65. This is in the better half of the industry: HALO outperforms 77.82% of its industry peers.
- The Debt to FCF ratio of HALO is 3.68, which is a good value as it means it would take HALO, 3.68 years of fcf income to pay off all of its debts.
- HALO has a Debt to FCF ratio of 3.68. This is amongst the best in the industry. HALO outperforms 95.42% of its industry peers.
- A Current Ratio of 7.41 indicates that HALO has no problem at all paying its short term obligations.
- The Current ratio of HALO (7.41) is better than 68.84% of its industry peers.
- HALO has a Quick Ratio of 6.21. This indicates that HALO is financially healthy and has no problem in meeting its short term obligations.
- With a decent Quick ratio value of 6.21, HALO is doing good in the industry, outperforming 62.68% of the companies in the same industry.
Understanding NASDAQ:HALO's Profitability
ChartMill's Profitability Rating offers a unique perspective on stock analysis, providing scores from 0 to 10. These ratings consider a wide range of profitability metrics and margins, both in comparison to industry peers and on their own merits. For NASDAQ:HALO, the assigned 7 is a significant indicator of profitability:
- HALO has a better Return On Assets (17.12%) than 98.59% of its industry peers.
- Looking at the Return On Equity, with a value of 116.53%, HALO belongs to the top of the industry, outperforming 99.82% of the companies in the same industry.
- With an excellent Return On Invested Capital value of 17.85%, HALO belongs to the best of the industry, outperforming 98.06% of the companies in the same industry.
- HALO had an Average Return On Invested Capital over the past 3 years of 17.78%. This is above the industry average of 13.00%.
- The last Return On Invested Capital (17.85%) for HALO is above the 3 year average (17.78%), which is a sign of increasing profitability.
- HALO has a Profit Margin of 38.62%. This is amongst the best in the industry. HALO outperforms 98.42% of its industry peers.
- HALO has a Operating Margin of 46.33%. This is amongst the best in the industry. HALO outperforms 99.65% of its industry peers.
- HALO has a better Gross Margin (79.96%) than 86.62% of its industry peers.
Every day, new Affordable Growth stocks can be found on ChartMill in our Affordable Growth screener.
Check the latest full fundamental report of HALO for a complete fundamental analysis.
Keep in mind
This article should in no way be interpreted as advice. The article is based on the observed metrics at the time of writing, but you should always make your own analysis and trade or invest at your own responsibility.