
Consider HALOZYME THERAPEUTICS INC (NASDAQ:HALO) as a top value stock, identified by our stock screening tool. NASDAQ:HALO shines in terms of profitability, solvency, and liquidity, all while remaining very reasonably priced. Let's dive deeper into the analysis.
Analyzing Valuation Metrics
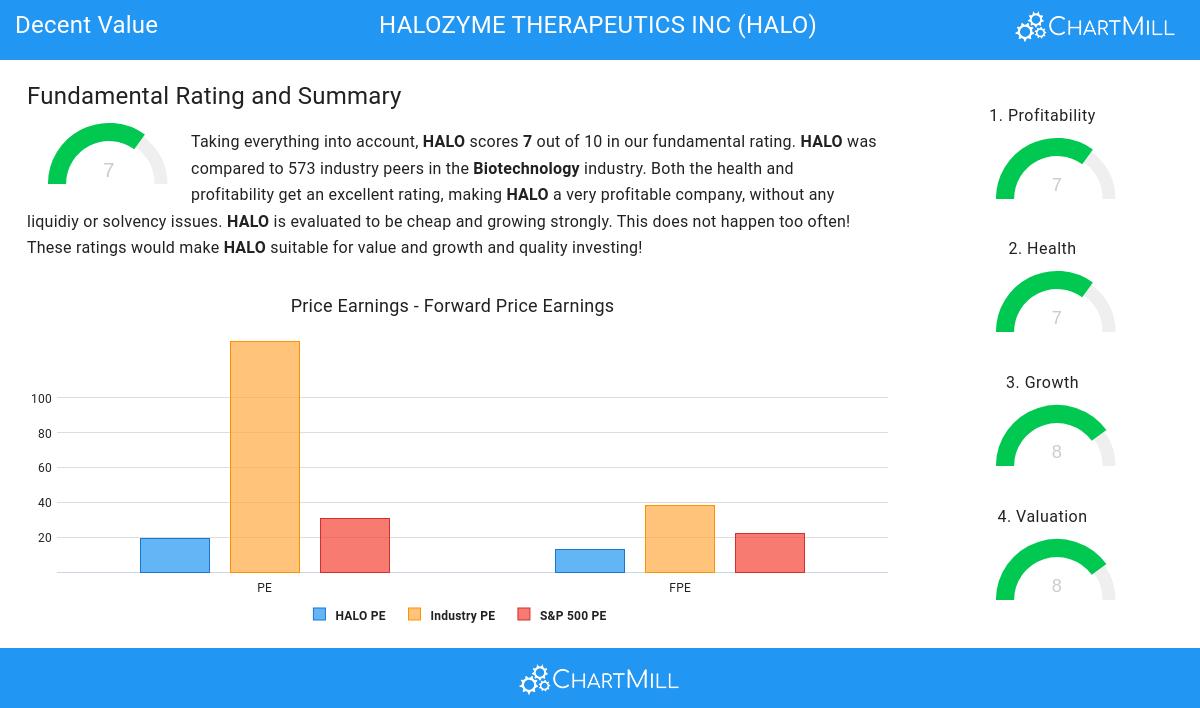
ChartMill assigns a Valuation Rating to each stock, ranging from 0 to 10. This rating is calculated by analyzing different valuation elements, such as price to earnings and free cash flow, both in absolute terms and relative to the market and industry. In the case of NASDAQ:HALO, the assigned 8 reflects its valuation:
- 96.83% of the companies in the same industry are more expensive than HALO, based on the Price/Earnings ratio.
- Compared to an average S&P500 Price/Earnings ratio of 30.45, HALO is valued a bit cheaper.
- Compared to the rest of the industry, the Price/Forward Earnings ratio of HALO indicates a rather cheap valuation: HALO is cheaper than 96.65% of the companies listed in the same industry.
- HALO is valuated rather cheaply when we compare the Price/Forward Earnings ratio to 21.99, which is the current average of the S&P500 Index.
- HALO's Enterprise Value to EBITDA ratio is rather cheap when compared to the industry. HALO is cheaper than 95.95% of the companies in the same industry.
- Based on the Price/Free Cash Flow ratio, HALO is valued cheaper than 97.18% of the companies in the same industry.
- The low PEG Ratio(NY), which compensates the Price/Earnings for growth, indicates a rather cheap valuation of the company.
- The decent profitability rating of HALO may justify a higher PE ratio.
- HALO's earnings are expected to grow with 32.05% in the coming years. This may justify a more expensive valuation.
Profitability Insights: NASDAQ:HALO
ChartMill assigns a proprietary Profitability Rating to each stock. The score is computed by evaluating various profitability ratios and margins and ranges from 0 to 10. NASDAQ:HALO was assigned a score of 7 for profitability:
- HALO's Return On Assets of 17.12% is amongst the best of the industry. HALO outperforms 98.59% of its industry peers.
- The Return On Equity of HALO (116.53%) is better than 99.82% of its industry peers.
- HALO has a Return On Invested Capital of 17.85%. This is amongst the best in the industry. HALO outperforms 98.06% of its industry peers.
- HALO had an Average Return On Invested Capital over the past 3 years of 17.78%. This is above the industry average of 13.00%.
- The 3 year average ROIC (17.78%) for HALO is below the current ROIC(17.85%), indicating increased profibility in the last year.
- HALO has a better Profit Margin (38.62%) than 98.42% of its industry peers.
- The Operating Margin of HALO (46.33%) is better than 99.65% of its industry peers.
- HALO has a better Gross Margin (79.96%) than 86.62% of its industry peers.
How do we evaluate the Health for NASDAQ:HALO?
Every stock is evaluated by ChartMill, receiving a Health Rating on a scale of 0 to 10. This assessment considers different health aspects, including liquidity and solvency, both in absolute terms and relative to industry peers. NASDAQ:HALO has achieved a 7 out of 10:
- HALO has an Altman-Z score of 4.65. This indicates that HALO is financially healthy and has little risk of bankruptcy at the moment.
- HALO has a Altman-Z score of 4.65. This is in the better half of the industry: HALO outperforms 77.82% of its industry peers.
- HALO has a debt to FCF ratio of 3.68. This is a good value and a sign of high solvency as HALO would need 3.68 years to pay back of all of its debts.
- HALO has a better Debt to FCF ratio (3.68) than 95.42% of its industry peers.
- HALO has a Current Ratio of 7.41. This indicates that HALO is financially healthy and has no problem in meeting its short term obligations.
- The Current ratio of HALO (7.41) is better than 68.84% of its industry peers.
- A Quick Ratio of 6.21 indicates that HALO has no problem at all paying its short term obligations.
- HALO has a Quick ratio of 6.21. This is in the better half of the industry: HALO outperforms 62.68% of its industry peers.
What does the Growth looks like for NASDAQ:HALO
ChartMill assigns a proprietary Growth Rating to each stock. The score is computed by evaluating various growth aspects, like EPS and revenue growth. We take into account the history as well as the estimated future numbers. NASDAQ:HALO was assigned a score of 8 for growth:
- The Earnings Per Share has grown by an impressive 34.57% over the past year.
- The Earnings Per Share has been growing by 45.64% on average over the past years. This is a very strong growth
- Looking at the last year, HALO shows a quite strong growth in Revenue. The Revenue has grown by 12.88% in the last year.
- Measured over the past years, HALO shows a very strong growth in Revenue. The Revenue has been growing by 40.42% on average per year.
- Based on estimates for the next years, HALO will show a very strong growth in Earnings Per Share. The EPS will grow by 25.47% on average per year.
- HALO is expected to show quite a strong growth in Revenue. In the coming years, the Revenue will grow by 15.95% yearly.
Our Decent Value screener lists more Decent Value stocks and is updated daily.
Check the latest full fundamental report of HALO for a complete fundamental analysis.
Disclaimer
This is not investing advice! The article highlights some of the observations at the time of writing, but you should always make your own analysis and invest based on your own insights.