
For growth-minded investors, high revenue and EPS growth are key criteria. Today, we'll examine whether HALOZYME THERAPEUTICS INC (NASDAQ:HALO) fits the bill for growth investing, particularly as it forms a base and hints at a potential breakout. Remember, due diligence is essential, but HALOZYME THERAPEUTICS INC has caught our attention on our screen for growth with base formation. It may warrant additional investigation.
Evaluating Growth: NASDAQ:HALO
A key component of ChartMill's stock assessment is the Growth Rating, which spans from 0 to 10. This rating evaluates diverse growth factors, such as EPS and revenue growth, considering both past performance and future projections. NASDAQ:HALO has received a 8 out of 10:
- The Earnings Per Share has grown by an impressive 34.57% over the past year.
- The Earnings Per Share has been growing by 45.64% on average over the past years. This is a very strong growth
- Looking at the last year, HALO shows a quite strong growth in Revenue. The Revenue has grown by 12.88% in the last year.
- Measured over the past years, HALO shows a very strong growth in Revenue. The Revenue has been growing by 40.42% on average per year.
- HALO is expected to show a strong growth in Earnings Per Share. In the coming years, the EPS will grow by 25.47% yearly.
- Based on estimates for the next years, HALO will show a quite strong growth in Revenue. The Revenue will grow by 15.95% on average per year.
Deciphering NASDAQ:HALO's Health Rating
ChartMill utilizes a Health Rating to assess stocks, scoring them on a scale of 0 to 10. This rating takes into account a variety of liquidity and solvency ratios, both in absolute terms and in comparison to industry peers. NASDAQ:HALO has earned a 7 out of 10:
- An Altman-Z score of 4.57 indicates that HALO is not in any danger for bankruptcy at the moment.
- Looking at the Altman-Z score, with a value of 4.57, HALO is in the better half of the industry, outperforming 78.62% of the companies in the same industry.
- HALO has a debt to FCF ratio of 3.68. This is a good value and a sign of high solvency as HALO would need 3.68 years to pay back of all of its debts.
- The Debt to FCF ratio of HALO (3.68) is better than 95.41% of its industry peers.
- A Current Ratio of 7.41 indicates that HALO has no problem at all paying its short term obligations.
- Looking at the Current ratio, with a value of 7.41, HALO is in the better half of the industry, outperforming 68.73% of the companies in the same industry.
- HALO has a Quick Ratio of 6.21. This indicates that HALO is financially healthy and has no problem in meeting its short term obligations.
- The Quick ratio of HALO (6.21) is better than 62.54% of its industry peers.
How do we evaluate the Profitability for NASDAQ:HALO?
ChartMill utilizes a Profitability Rating to assess stocks, scoring them on a scale of 0 to 10. This rating takes into account a variety of profitability ratios and margins, both in absolute terms and in comparison to industry peers. NASDAQ:HALO has earned a 7 out of 10:
- HALO has a Return On Assets of 17.12%. This is amongst the best in the industry. HALO outperforms 98.59% of its industry peers.
- Looking at the Return On Equity, with a value of 116.53%, HALO belongs to the top of the industry, outperforming 99.82% of the companies in the same industry.
- HALO's Return On Invested Capital of 17.85% is amongst the best of the industry. HALO outperforms 98.06% of its industry peers.
- HALO had an Average Return On Invested Capital over the past 3 years of 17.78%. This is above the industry average of 13.00%.
- The last Return On Invested Capital (17.85%) for HALO is above the 3 year average (17.78%), which is a sign of increasing profitability.
- HALO has a better Profit Margin (38.62%) than 98.41% of its industry peers.
- Looking at the Operating Margin, with a value of 46.33%, HALO belongs to the top of the industry, outperforming 99.65% of the companies in the same industry.
- The Gross Margin of HALO (79.96%) is better than 86.75% of its industry peers.
How do we evaluate the setup for NASDAQ:HALO?
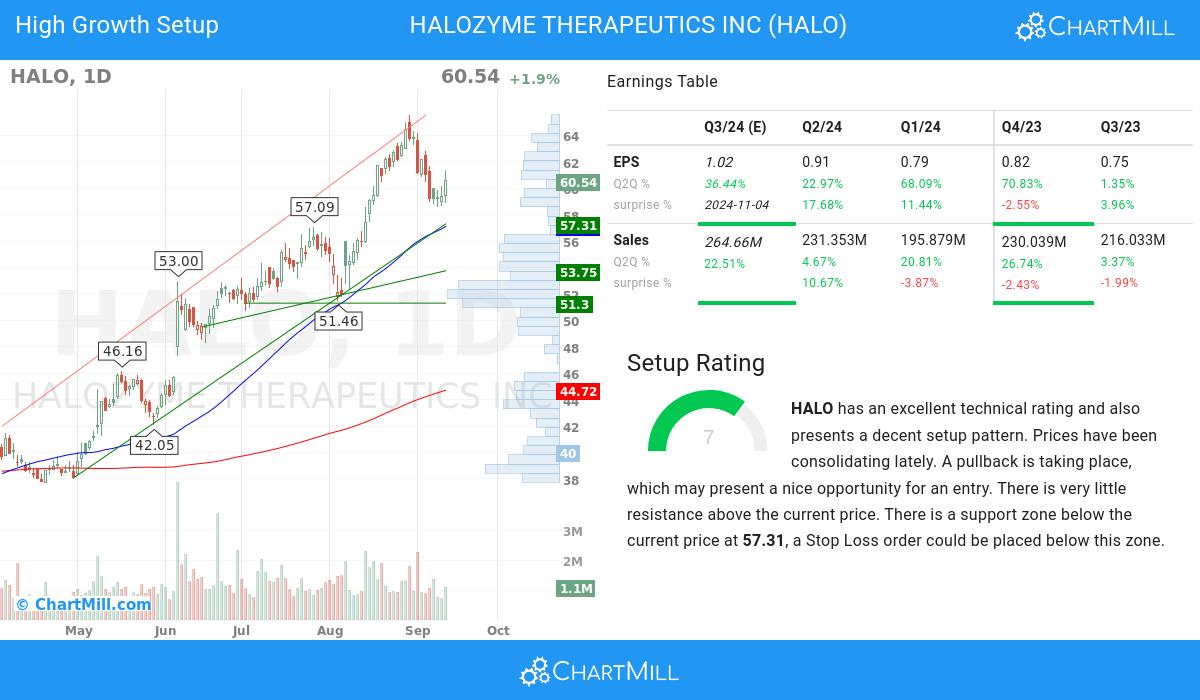
Alongside the Technical Rating, ChartMill assigns a Setup Rating to evaluate the consolidation level of a stock. This rating, ranging from 0 to 10, is updated daily and considers various short-term technical indicators. The current setup rating for NASDAQ:HALO is 7:
Besides having an excellent technical rating, HALO also presents a decent setup pattern. Prices have been consolidating lately. A pullback is taking place, which may present a nice opportunity for an entry. There is very little resistance above the current price. There is a support zone below the current price at 57.31, a Stop Loss order could be placed below this zone.
Our Strong Growth screener lists more Strong Growth stocks and is updated daily.
For an up to date full fundamental analysis you can check the fundamental report of HALO
Our latest full technical report of HALO contains the most current technical analsysis.
Keep in mind
Important Note: The content of this article is not intended as trading advice. It is essential to perform your own analysis and exercise caution when making trading decisions. The article presents observations created by automated analysis but does not guarantee any trading or investment outcomes. Always trade responsibly and make independent judgments.