
Our stock screening tool has pinpointed HALLIBURTON CO (NYSE:HAL) as an undervalued stock. NYSE:HAL maintains a solid financial footing. Furthermore, it remains attractively priced. Let's delve into the specifics below.
Valuation Assessment of NYSE:HAL
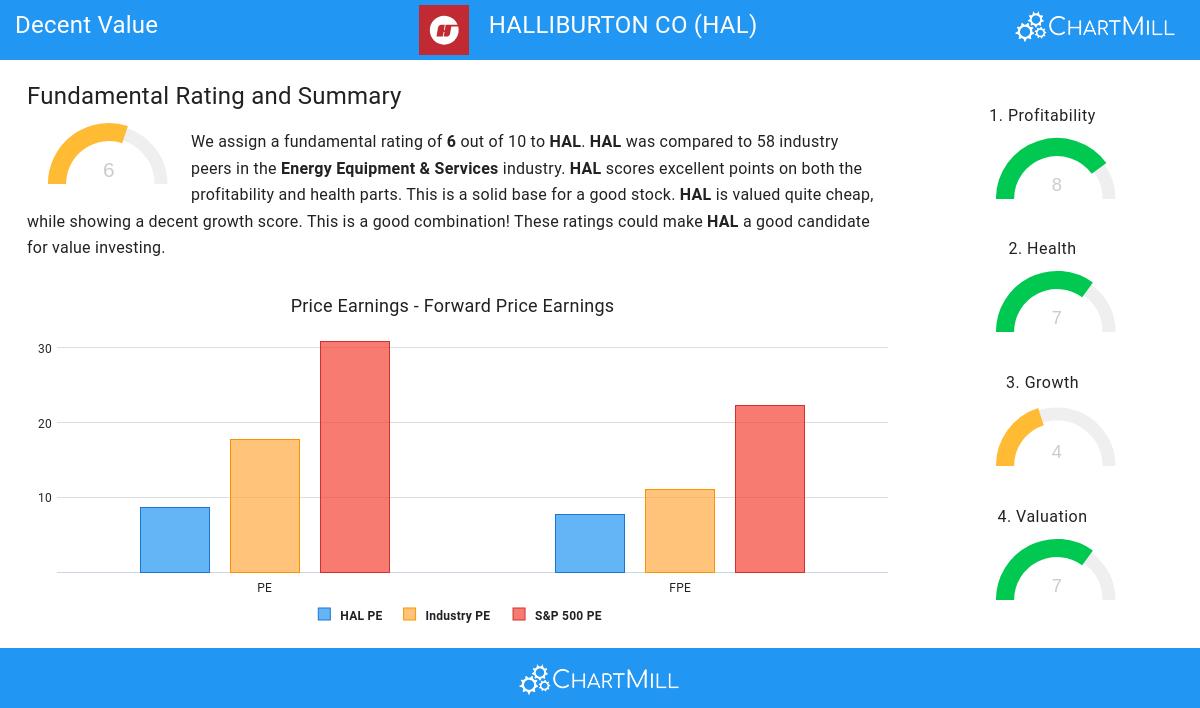
ChartMill assigns a Valuation Rating to each stock, ranging from 0 to 10. This rating is calculated by analyzing different valuation elements, such as price to earnings and free cash flow, both in absolute terms and relative to the market and industry. In the case of NYSE:HAL, the assigned 7 reflects its valuation:
- HAL is valuated reasonably with a Price/Earnings ratio of 8.66.
- Compared to the rest of the industry, the Price/Earnings ratio of HAL indicates a rather cheap valuation: HAL is cheaper than 91.38% of the companies listed in the same industry.
- The average S&P500 Price/Earnings ratio is at 30.91. HAL is valued rather cheaply when compared to this.
- With a Price/Forward Earnings ratio of 7.74, the valuation of HAL can be described as very cheap.
- Compared to the rest of the industry, the Price/Forward Earnings ratio of HAL indicates a somewhat cheap valuation: HAL is cheaper than 75.86% of the companies listed in the same industry.
- Compared to an average S&P500 Price/Forward Earnings ratio of 22.30, HAL is valued rather cheaply.
- Compared to the rest of the industry, the Enterprise Value to EBITDA ratio of HAL indicates a somewhat cheap valuation: HAL is cheaper than 60.34% of the companies listed in the same industry.
- Based on the Price/Free Cash Flow ratio, HAL is valued a bit cheaper than the industry average as 65.52% of the companies are valued more expensively.
- HAL has an outstanding profitability rating, which may justify a higher PE ratio.
How do we evaluate the Profitability for NYSE:HAL?
ChartMill employs its own Profitability Rating system for stock evaluation. This score, ranging from 0 to 10, is derived from an analysis of diverse profitability metrics and margins. In the case of NYSE:HAL, the assigned 8 is noteworthy for profitability:
- The Return On Assets of HAL (10.70%) is better than 86.21% of its industry peers.
- With an excellent Return On Equity value of 26.92%, HAL belongs to the best of the industry, outperforming 91.38% of the companies in the same industry.
- HAL has a Return On Invested Capital of 16.26%. This is amongst the best in the industry. HAL outperforms 93.10% of its industry peers.
- HAL had an Average Return On Invested Capital over the past 3 years of 12.54%. This is above the industry average of 8.12%.
- The last Return On Invested Capital (16.26%) for HAL is above the 3 year average (12.54%), which is a sign of increasing profitability.
- HAL has a better Profit Margin (11.61%) than 75.86% of its industry peers.
- HAL's Profit Margin has improved in the last couple of years.
- HAL has a better Operating Margin (17.75%) than 81.03% of its industry peers.
- HAL's Operating Margin has improved in the last couple of years.
- In the last couple of years the Gross Margin of HAL has grown nicely.
ChartMill's Evaluation of Health
Every stock is evaluated by ChartMill, receiving a Health Rating on a scale of 0 to 10. This assessment considers different health aspects, including liquidity and solvency, both in absolute terms and relative to industry peers. NYSE:HAL has achieved a 7 out of 10:
- An Altman-Z score of 3.48 indicates that HAL is not in any danger for bankruptcy at the moment.
- Looking at the Altman-Z score, with a value of 3.48, HAL belongs to the top of the industry, outperforming 82.76% of the companies in the same industry.
- The Debt to FCF ratio of HAL is 3.23, which is a good value as it means it would take HAL, 3.23 years of fcf income to pay off all of its debts.
- With a decent Debt to FCF ratio value of 3.23, HAL is doing good in the industry, outperforming 63.79% of the companies in the same industry.
- A Current Ratio of 2.13 indicates that HAL has no problem at all paying its short term obligations.
- With a decent Current ratio value of 2.13, HAL is doing good in the industry, outperforming 63.79% of the companies in the same industry.
Growth Analysis for NYSE:HAL
A key component of ChartMill's stock assessment is the Growth Rating, which spans from 0 to 10. This rating evaluates diverse growth factors, such as EPS and revenue growth, considering both past performance and future projections. NYSE:HAL has received a 4 out of 10:
- HAL shows a strong growth in Earnings Per Share. In the last year, the EPS has been growing by 14.23%, which is quite good.
- Measured over the past years, HAL shows a quite strong growth in Earnings Per Share. The EPS has been growing by 10.57% on average per year.
- When comparing the Revenue growth rate of the last years to the growth rate of the upcoming years, we see that the growth is accelerating.
More Decent Value stocks can be found in our Decent Value screener.
Check the latest full fundamental report of HAL for a complete fundamental analysis.
Keep in mind
This article should in no way be interpreted as advice. The article is based on the observed metrics at the time of writing, but you should always make your own analysis and trade or invest at your own responsibility.