
Despite its growth, NYSE:HAE remains within the realm of affordability.
By Mill Chart
Last update: Oct 10, 2024
HAEMONETICS CORP/MASS (NYSE:HAE) was identified as an affordable growth stock by our stock screener. NYSE:HAE is showing great growth, but also scores well on profitability, solvency and liquidity. At the same time it seems to be priced reasonably. We'll explore this a bit deeper below.
Deciphering NYSE:HAE's Growth Rating
A key component of ChartMill's stock assessment is the Growth Rating, which spans from 0 to 10. This rating evaluates diverse growth factors, such as EPS and revenue growth, considering both past performance and future projections. NYSE:HAE has received a 7 out of 10:
- The Earnings Per Share has grown by an nice 12.86% over the past year.
- Measured over the past years, HAE shows a quite strong growth in Earnings Per Share. The EPS has been growing by 10.74% on average per year.
- HAE shows quite a strong growth in Revenue. In the last year, the Revenue has grown by 9.47%.
- The Earnings Per Share is expected to grow by 21.40% on average over the next years. This is a very strong growth
- The Revenue is expected to grow by 10.74% on average over the next years. This is quite good.
- The EPS growth rate is accelerating: in the next years the growth will be better than in the last years.
- The Revenue growth rate is accelerating: in the next years the growth will be better than in the last years.
Valuation Assessment of NYSE:HAE
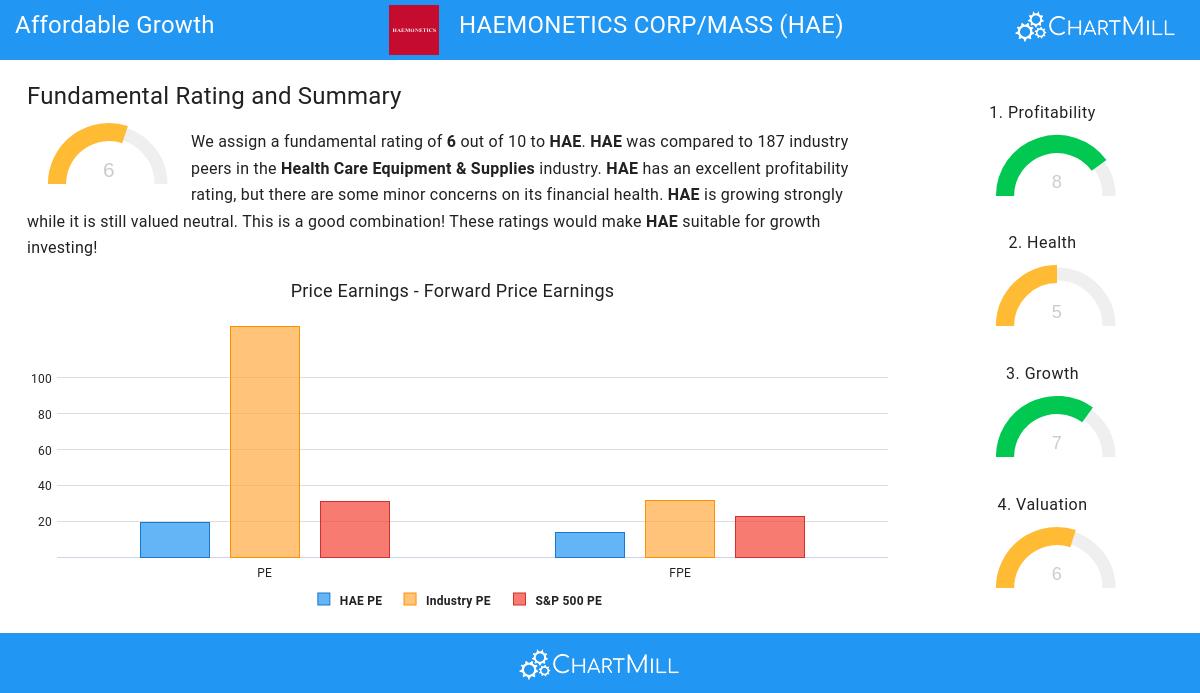
An integral part of ChartMill's stock analysis is the Valuation Rating, which spans from 0 to 10. This rating evaluates diverse valuation factors, including price to earnings and cash flows, while considering the stock's profitability and growth. NYSE:HAE has received a 6 out of 10:
- 85.48% of the companies in the same industry are more expensive than HAE, based on the Price/Earnings ratio.
- Compared to an average S&P500 Price/Earnings ratio of 31.24, HAE is valued a bit cheaper.
- 92.47% of the companies in the same industry are more expensive than HAE, based on the Price/Forward Earnings ratio.
- Compared to an average S&P500 Price/Forward Earnings ratio of 22.44, HAE is valued a bit cheaper.
- Based on the Enterprise Value to EBITDA ratio, HAE is valued cheaper than 85.48% of the companies in the same industry.
- Compared to the rest of the industry, the Price/Free Cash Flow ratio of HAE indicates a somewhat cheap valuation: HAE is cheaper than 76.34% of the companies listed in the same industry.
- The excellent profitability rating of HAE may justify a higher PE ratio.
- A more expensive valuation may be justified as HAE's earnings are expected to grow with 16.85% in the coming years.
Health Insights: NYSE:HAE
ChartMill assigns a Health Rating to every stock. This score ranges from 0 to 10 and evaluates the different health aspects like liquidity and solvency, both absolutely, but also relative to the industry peers. NYSE:HAE scores a 5 out of 10:
- Looking at the Altman-Z score, with a value of 2.77, HAE is in the better half of the industry, outperforming 63.44% of the companies in the same industry.
- HAE has a better Debt to FCF ratio (17.79) than 70.97% of its industry peers.
- A Current Ratio of 3.76 indicates that HAE has no problem at all paying its short term obligations.
- HAE has a Current ratio of 3.76. This is in the better half of the industry: HAE outperforms 60.75% of its industry peers.
- A Quick Ratio of 2.33 indicates that HAE has no problem at all paying its short term obligations.
A Closer Look at Profitability for NYSE:HAE
ChartMill utilizes a Profitability Rating to assess stocks, scoring them on a scale of 0 to 10. This rating takes into account a variety of profitability ratios and margins, both in absolute terms and in comparison to industry peers. NYSE:HAE has earned a 8 out of 10:
- HAE has a better Return On Assets (4.52%) than 81.72% of its industry peers.
- HAE has a Return On Equity of 12.69%. This is amongst the best in the industry. HAE outperforms 88.71% of its industry peers.
- The Return On Invested Capital of HAE (7.17%) is better than 84.95% of its industry peers.
- HAE has a better Profit Margin (8.61%) than 81.18% of its industry peers.
- HAE's Profit Margin has improved in the last couple of years.
- HAE has a better Operating Margin (15.43%) than 86.02% of its industry peers.
- In the last couple of years the Operating Margin of HAE has grown nicely.
- In the last couple of years the Gross Margin of HAE has grown nicely.
More Affordable Growth stocks can be found in our Affordable Growth screener.
For an up to date full fundamental analysis you can check the fundamental report of HAE
Keep in mind
This is not investing advice! The article highlights some of the observations at the time of writing, but you should always make your own analysis and invest based on your own insights.