
HAEMONETICS CORP/MASS (NYSE:HAE) was identified as an affordable growth stock by our stock screener. NYSE:HAE is showing great growth, but also scores well on profitability, solvency and liquidity. At the same time it seems to be priced reasonably. We'll explore this a bit deeper below.
Growth Assessment of NYSE:HAE
ChartMill employs its own Growth Rating system for all stocks. This score, ranging from 0 to 10, is derived by evaluating different growth factors, such as EPS and revenue growth, taking into account both past performance and future projections. NYSE:HAE has earned a 7 for growth:
- The Earnings Per Share has grown by an nice 12.86% over the past year.
- HAE shows quite a strong growth in Earnings Per Share. Measured over the last years, the EPS has been growing by 10.74% yearly.
- The Revenue has grown by 9.47% in the past year. This is quite good.
- HAE is expected to show a strong growth in Earnings Per Share. In the coming years, the EPS will grow by 21.40% yearly.
- Based on estimates for the next years, HAE will show a quite strong growth in Revenue. The Revenue will grow by 10.74% on average per year.
- When comparing the EPS growth rate of the last years to the growth rate of the upcoming years, we see that the growth is accelerating.
- The Revenue growth rate is accelerating: in the next years the growth will be better than in the last years.
Understanding NYSE:HAE's Valuation Score
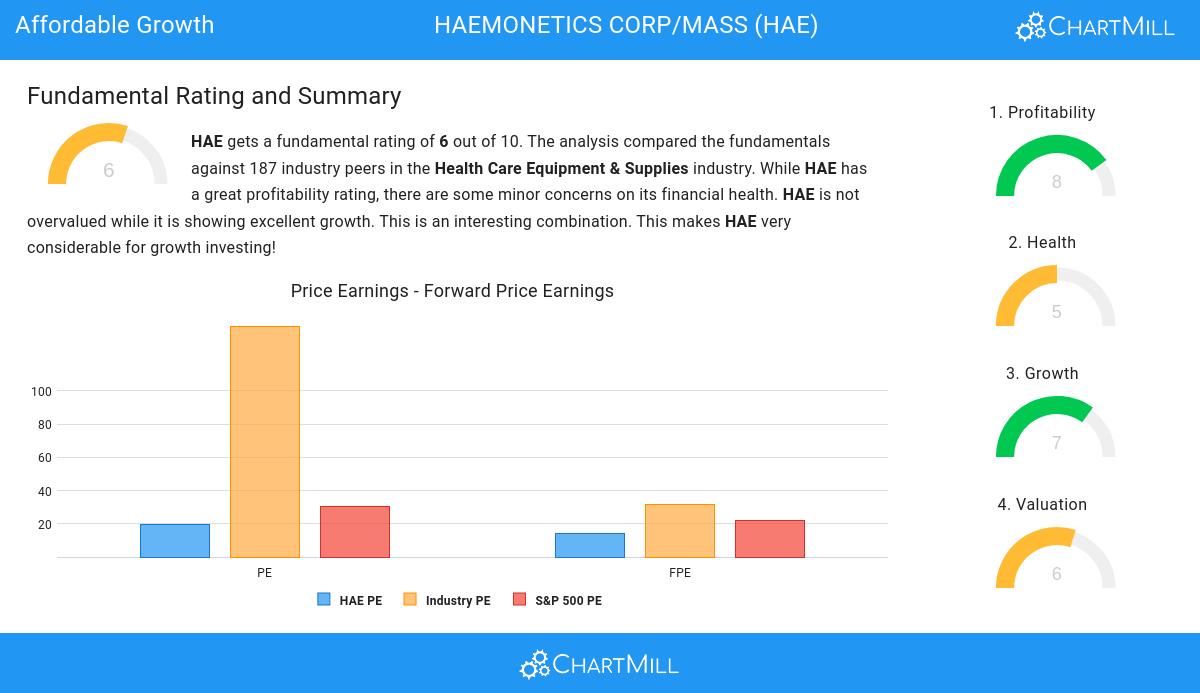
ChartMill assigns a Valuation Rating to every stock. This score ranges from 0 to 10 and evaluates the different valuation aspects and compares the price to earnings and cash flows, while taking into account profitability and growth. NYSE:HAE scores a 6 out of 10:
- 87.70% of the companies in the same industry are more expensive than HAE, based on the Price/Earnings ratio.
- When comparing the Price/Earnings ratio of HAE to the average of the S&P500 Index (30.57), we can say HAE is valued slightly cheaper.
- Based on the Price/Forward Earnings ratio, HAE is valued cheaply inside the industry as 93.58% of the companies are valued more expensively.
- Compared to an average S&P500 Price/Forward Earnings ratio of 22.04, HAE is valued a bit cheaper.
- Based on the Enterprise Value to EBITDA ratio, HAE is valued cheaply inside the industry as 85.56% of the companies are valued more expensively.
- HAE's Price/Free Cash Flow ratio is a bit cheaper when compared to the industry. HAE is cheaper than 77.01% of the companies in the same industry.
- HAE has an outstanding profitability rating, which may justify a higher PE ratio.
- A more expensive valuation may be justified as HAE's earnings are expected to grow with 16.85% in the coming years.
How do we evaluate the Health for NYSE:HAE?
Every stock is evaluated by ChartMill, receiving a Health Rating on a scale of 0 to 10. This assessment considers different health aspects, including liquidity and solvency, both in absolute terms and relative to industry peers. NYSE:HAE has achieved a 5 out of 10:
- HAE's Altman-Z score of 2.78 is fine compared to the rest of the industry. HAE outperforms 62.57% of its industry peers.
- HAE's Debt to FCF ratio of 17.79 is fine compared to the rest of the industry. HAE outperforms 71.12% of its industry peers.
- A Current Ratio of 3.76 indicates that HAE has no problem at all paying its short term obligations.
- HAE has a better Current ratio (3.76) than 60.43% of its industry peers.
- A Quick Ratio of 2.33 indicates that HAE has no problem at all paying its short term obligations.
Analyzing Profitability Metrics
ChartMill employs its own Profitability Rating system for stock evaluation. This score, ranging from 0 to 10, is derived from an analysis of diverse profitability metrics and margins. In the case of NYSE:HAE, the assigned 8 is noteworthy for profitability:
- Looking at the Return On Assets, with a value of 4.52%, HAE belongs to the top of the industry, outperforming 81.82% of the companies in the same industry.
- HAE has a Return On Equity of 12.69%. This is amongst the best in the industry. HAE outperforms 88.24% of its industry peers.
- The Return On Invested Capital of HAE (7.17%) is better than 85.56% of its industry peers.
- HAE has a better Profit Margin (8.61%) than 81.28% of its industry peers.
- HAE's Profit Margin has improved in the last couple of years.
- The Operating Margin of HAE (15.43%) is better than 86.10% of its industry peers.
- HAE's Operating Margin has improved in the last couple of years.
- In the last couple of years the Gross Margin of HAE has grown nicely.
Our Affordable Growth screener lists more Affordable Growth stocks and is updated daily.
Our latest full fundamental report of HAE contains the most current fundamental analsysis.
Keep in mind
This is not investing advice! The article highlights some of the observations at the time of writing, but you should always make your own analysis and invest based on your own insights.