NASDAQ:GOOGL stands out as a growth opportunity that won't break the bank.
By Mill Chart
Last update: Feb 12, 2025
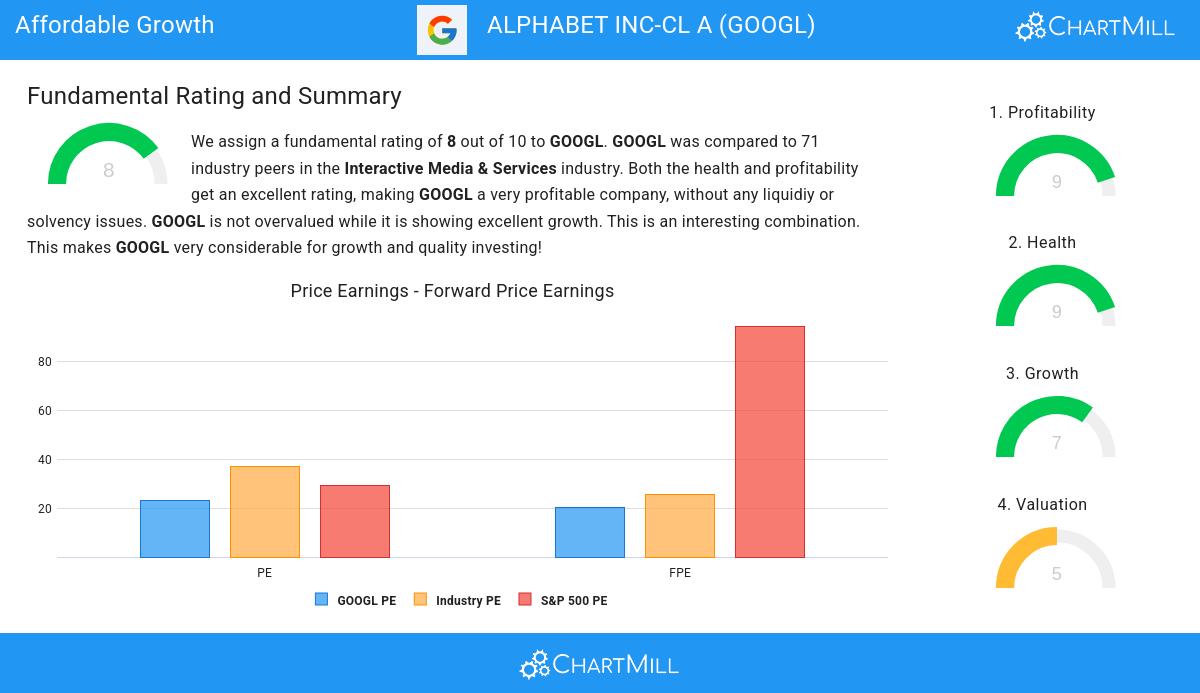
Our stock screener has singled out ALPHABET INC-CL A (NASDAQ:GOOGL) as an attractive growth opportunity. NASDAQ:GOOGL is demonstrating remarkable growth potential while maintaining strong financial indicators, making it a reasonably priced option. We'll explore this further.
Assessing Growth for NASDAQ:GOOGL
To evaluate a stock's growth potential, ChartMill utilizes a Growth Rating on a scale of 0 to 10. This comprehensive assessment considers various growth aspects, including historical and estimated EPS and revenue growth. NASDAQ:GOOGL has achieved a 7 out of 10:
- The Earnings Per Share has grown by an impressive 38.79% over the past year.
- The Earnings Per Share has been growing by 25.25% on average over the past years. This is a very strong growth
- The Revenue has grown by 13.87% in the past year. This is quite good.
- Measured over the past years, GOOGL shows a quite strong growth in Revenue. The Revenue has been growing by 16.68% on average per year.
- The Earnings Per Share is expected to grow by 16.13% on average over the next years. This is quite good.
- The Revenue is expected to grow by 10.86% on average over the next years. This is quite good.
Exploring NASDAQ:GOOGL's Valuation
ChartMill employs its own Valuation Rating system for all stocks. This score, ranging from 0 to 10, is determined by evaluating different valuation factors, including price to earnings and free cash flow, both in absolute terms and relative to the market and industry. NASDAQ:GOOGL has earned a 5 for valuation:
- Compared to the rest of the industry, the Price/Earnings ratio of GOOGL indicates a somewhat cheap valuation: GOOGL is cheaper than 71.21% of the companies listed in the same industry.
- When comparing the Price/Earnings ratio of GOOGL to the average of the S&P500 Index (29.39), we can say GOOGL is valued slightly cheaper.
- 68.18% of the companies in the same industry are more expensive than GOOGL, based on the Price/Forward Earnings ratio.
- GOOGL is valuated cheaply when we compare the Price/Forward Earnings ratio to 94.38, which is the current average of the S&P500 Index.
- Based on the Enterprise Value to EBITDA ratio, GOOGL is valued a bit cheaper than 66.67% of the companies in the same industry.
- GOOGL's Price/Free Cash Flow ratio is a bit cheaper when compared to the industry. GOOGL is cheaper than 63.64% of the companies in the same industry.
- GOOGL has an outstanding profitability rating, which may justify a higher PE ratio.
- GOOGL's earnings are expected to grow with 14.64% in the coming years. This may justify a more expensive valuation.
A Closer Look at Health for NASDAQ:GOOGL
ChartMill assigns a Health Rating to every stock. This score ranges from 0 to 10 and evaluates the different health aspects like liquidity and solvency, both absolutely, but also relative to the industry peers. NASDAQ:GOOGL scores a 9 out of 10:
- An Altman-Z score of 13.45 indicates that GOOGL is not in any danger for bankruptcy at the moment.
- GOOGL's Altman-Z score of 13.45 is amongst the best of the industry. GOOGL outperforms 89.39% of its industry peers.
- The Debt to FCF ratio of GOOGL is 0.17, which is an excellent value as it means it would take GOOGL, only 0.17 years of fcf income to pay off all of its debts.
- Looking at the Debt to FCF ratio, with a value of 0.17, GOOGL belongs to the top of the industry, outperforming 80.30% of the companies in the same industry.
- A Debt/Equity ratio of 0.03 indicates that GOOGL is not too dependend on debt financing.
- GOOGL does not score too well on the current and quick ratio evaluation. However, as it has excellent solvency and profitability, these ratios do not necessarly indicate liquidity issues and need to be evaluated against the specifics of the business.
Profitability Assessment of NASDAQ:GOOGL
ChartMill's Profitability Rating offers a unique perspective on stock analysis, providing scores from 0 to 10. These ratings consider a wide range of profitability metrics and margins, both in comparison to industry peers and on their own merits. For NASDAQ:GOOGL, the assigned 9 is a significant indicator of profitability:
- GOOGL has a better Return On Assets (22.24%) than 95.45% of its industry peers.
- With an excellent Return On Equity value of 30.80%, GOOGL belongs to the best of the industry, outperforming 96.97% of the companies in the same industry.
- GOOGL has a Return On Invested Capital of 27.32%. This is amongst the best in the industry. GOOGL outperforms 96.97% of its industry peers.
- Measured over the past 3 years, the Average Return On Invested Capital for GOOGL is significantly above the industry average of 12.54%.
- The last Return On Invested Capital (27.32%) for GOOGL is above the 3 year average (24.15%), which is a sign of increasing profitability.
- GOOGL's Profit Margin of 28.60% is amongst the best of the industry. GOOGL outperforms 93.94% of its industry peers.
- In the last couple of years the Profit Margin of GOOGL has grown nicely.
- GOOGL's Operating Margin of 32.79% is amongst the best of the industry. GOOGL outperforms 98.48% of its industry peers.
- In the last couple of years the Operating Margin of GOOGL has grown nicely.
More Affordable Growth stocks can be found in our Affordable Growth screener.
Check the latest full fundamental report of GOOGL for a complete fundamental analysis.
Keep in mind
This is not investing advice! The article highlights some of the observations at the time of writing, but you should always make your own analysis and invest based on your own insights.
151.16
-2.17 (-1.42%)
Find more stocks in the Stock Screener
GOOGL Latest News and Analysis
 10 hours ago - ChartmillDon't overlook ALPHABET INC-CL A (NASDAQ:GOOGL)—a stock with solid growth prospects and a reasonable valuation.
Based on Fundamental Analysis it can be said that NASDAQ:GOOGL is a growth stock which is not overvalued.
 5 days ago - ChartmillALPHABET INC-CL A (NASDAQ:GOOGL) Exhibits Quality Stock Traits. Here's Why.
A fundamental analysis of (NASDAQ:GOOGL): Why Quality Investors Should Delve into ALPHABET INC-CL A (NASDAQ:GOOGL) for Investment Opportunities.
 11 days ago - ChartmillStay informed about the most active stocks in the S&P500 index on Monday's session.
Looking for the most active stocks in the S&P500 index on Monday? Dive into today's session and discover the stocks that are dominating the trading activity and setting the pace for the market.
18 days ago - ChartmillCurious about the most active S&P500 stocks in today's session?Stay informed about the most active stocks in the S&P500 index on Monday's session. Discover the stocks that are generating the highest trading volume and driving market activity.
 19 days ago - ChartmillDoes ALPHABET INC-CL A (NASDAQ:GOOGL) match Peter Lynch’s “Invest in What You Know” philosophy?
Let’s dive into ALPHABET INC-CL A (NASDAQ:GOOGL) using Peter Lynch’s key investing principles, from earnings growth and debt levels to long-term scalability and valuation.
