
NYSE:GMED is showing good growth, while it is not too expensive.
By Mill Chart
Last update: Oct 2, 2024
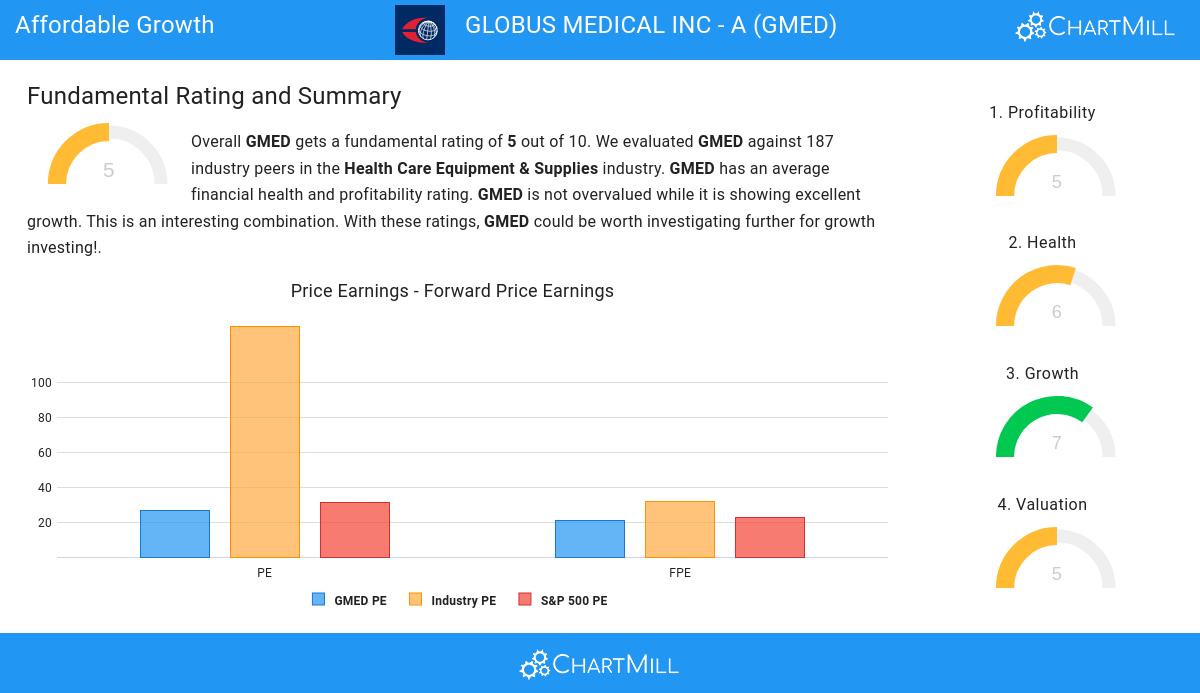
GLOBUS MEDICAL INC - A (NYSE:GMED) has caught the eye of our stock screener as an affordable growth stock. NYSE:GMED is displaying robust growth metrics and also excels in terms of profitability, solvency, and liquidity. Additionally, it appears to be reasonably priced. Let's delve into the details.
What does the Growth looks like for NYSE:GMED
ChartMill assigns a proprietary Growth Rating to each stock. The score is computed by evaluating various growth aspects, like EPS and revenue growth. We take into account the history as well as the estimated future numbers. NYSE:GMED was assigned a score of 7 for growth:
- GMED shows a strong growth in Earnings Per Share. In the last year, the EPS has been growing by 17.33%, which is quite good.
- Looking at the last year, GMED shows a very strong growth in Revenue. The Revenue has grown by 103.89%.
- The Revenue has been growing by 17.08% on average over the past years. This is quite good.
- The Earnings Per Share is expected to grow by 17.70% on average over the next years. This is quite good.
- The Revenue is expected to grow by 17.25% on average over the next years. This is quite good.
- When comparing the EPS growth rate of the last years to the growth rate of the upcoming years, we see that the growth is accelerating.
Valuation Examination for NYSE:GMED
ChartMill assigns a Valuation Rating to each stock, ranging from 0 to 10. This rating is calculated by analyzing different valuation elements, such as price to earnings and free cash flow, both in absolute terms and relative to the market and industry. In the case of NYSE:GMED, the assigned 5 reflects its valuation:
- Compared to the rest of the industry, the Price/Earnings ratio of GMED indicates a rather cheap valuation: GMED is cheaper than 80.11% of the companies listed in the same industry.
- Based on the Price/Forward Earnings ratio, GMED is valued cheaper than 83.87% of the companies in the same industry.
- Based on the Enterprise Value to EBITDA ratio, GMED is valued a bit cheaper than the industry average as 75.27% of the companies are valued more expensively.
- Compared to the rest of the industry, the Price/Free Cash Flow ratio of GMED indicates a somewhat cheap valuation: GMED is cheaper than 76.34% of the companies listed in the same industry.
- A more expensive valuation may be justified as GMED's earnings are expected to grow with 19.20% in the coming years.
Understanding NYSE:GMED's Health Score
ChartMill employs its own Health Rating for stock assessment. This rating, ranging from 0 to 10, is calculated by examining various liquidity and solvency ratios. In the case of NYSE:GMED, the assigned 6 reflects its health status:
- An Altman-Z score of 6.75 indicates that GMED is not in any danger for bankruptcy at the moment.
- GMED has a Altman-Z score of 6.75. This is amongst the best in the industry. GMED outperforms 85.48% of its industry peers.
- The Debt to FCF ratio of GMED is 2.68, which is a good value as it means it would take GMED, 2.68 years of fcf income to pay off all of its debts.
- GMED's Debt to FCF ratio of 2.68 is amongst the best of the industry. GMED outperforms 87.10% of its industry peers.
- A Debt/Equity ratio of 0.00 indicates that GMED is not too dependend on debt financing.
- Looking at the Debt to Equity ratio, with a value of 0.00, GMED is in the better half of the industry, outperforming 68.28% of the companies in the same industry.
- A Current Ratio of 2.42 indicates that GMED has no problem at all paying its short term obligations.
Analyzing Profitability Metrics
ChartMill assigns a Profitability Rating to every stock. This score ranges from 0 to 10 and evaluates the different profitability ratios and margins, both absolutely, but also relative to the industry peers. NYSE:GMED scores a 5 out of 10:
- GMED has a Return On Assets of 0.81%. This is in the better half of the industry: GMED outperforms 72.58% of its industry peers.
- With a decent Return On Equity value of 1.02%, GMED is doing good in the industry, outperforming 72.58% of the companies in the same industry.
- GMED has a better Return On Invested Capital (3.06%) than 73.12% of its industry peers.
- The Profit Margin of GMED (1.82%) is better than 74.19% of its industry peers.
- GMED's Operating Margin of 7.53% is fine compared to the rest of the industry. GMED outperforms 74.19% of its industry peers.
More Affordable Growth stocks can be found in our Affordable Growth screener.
For an up to date full fundamental analysis you can check the fundamental report of GMED
Keep in mind
Important Note: The content of this article is not intended as trading advice. It is essential to perform your own analysis and exercise caution when making trading decisions. The article presents observations created by automated analysis but does not guarantee any trading or investment outcomes. Always trade responsibly and make independent judgments.
